#4 Uji Normalitas Chi Square dengan Excel - Statistika Pendidikan
Summary
TLDRIn this video, a Chi-square test for normality is conducted using the practice test scores of 30 students from class 5A. The process includes organizing data into frequency classes, calculating expected frequencies based on normal distribution, and applying the Chi-square formula to test if the data follows a normal distribution. Key steps involve determining class width, calculating the test statistic, and comparing it to the Chi-square distribution table. The final conclusion helps determine whether the null hypothesis, that the data is normally distributed, is accepted or rejected.
Takeaways
- 😀 The video introduces a Chi-square test to test the normality of data, using a sample of 30 students' prayer practice scores.
- 😀 The significance level (alpha) for the test is set at 5% or 0.05.
- 😀 The first step is to organize the data into frequency groups based on the highest and lowest values.
- 😀 The number of classes (intervals) is determined using a formula, resulting in 6 classes in this case.
- 😀 The width of each class interval is calculated using the formula, rounded to 5 units.
- 😀 The data is organized into a frequency table using Excel, making it easier to calculate necessary values.
- 😀 The midpoints of each class interval are calculated by averaging the upper and lower bounds of the class.
- 😀 The mean (average) of the data is calculated using the sum of the products of frequencies and midpoints divided by the total frequency.
- 😀 The variance and standard deviation of the data are computed to understand its spread and variability.
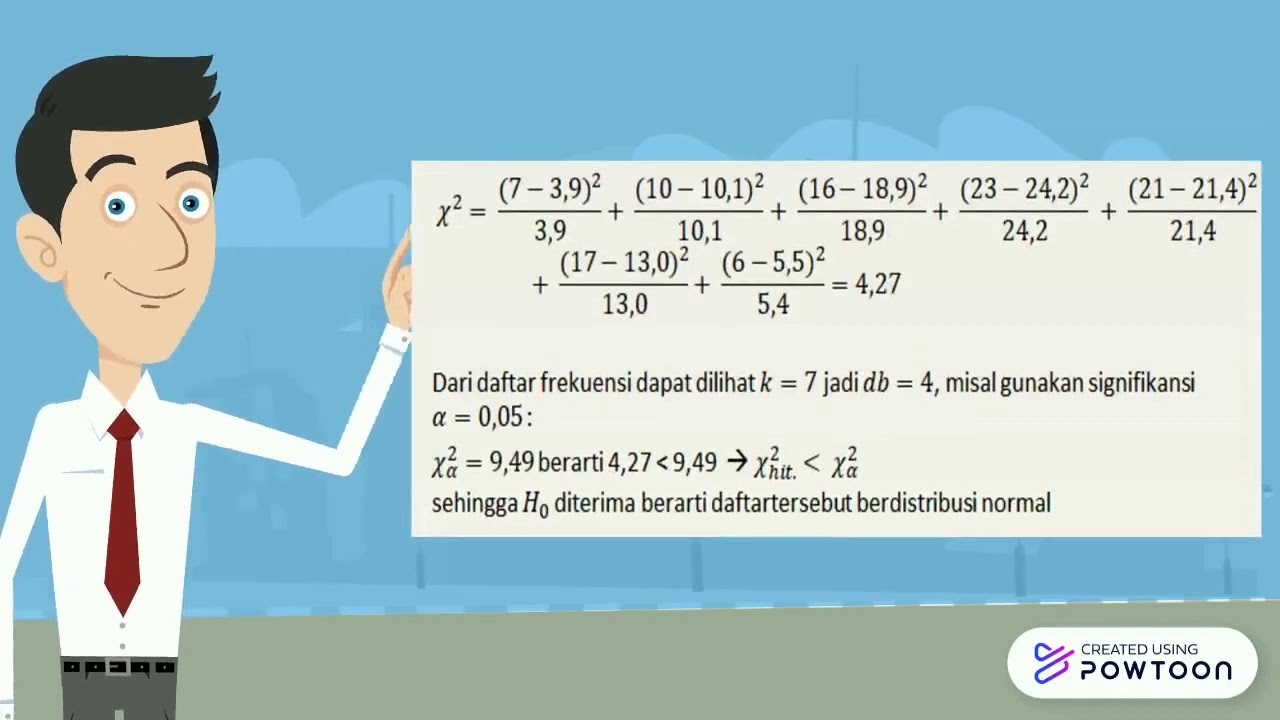
- 😀 The Chi-square statistic is calculated by comparing the observed frequencies with the expected frequencies.
- 😀 After calculating the Chi-square value and comparing it to the critical value from the Chi-square distribution table, the hypothesis is tested.
- 😀 If the Chi-square value is smaller than the table value, the null hypothesis (Ho) is accepted, indicating that the data is normally distributed.
Q & A
What statistical test is being used in this script to test normality?
-The Chi-square test is used in the script to test whether the data follows a normal distribution.
How many students' practice scores are being analyzed in the script?
-The data consists of the practice scores of 30 students in Class 5A.
What is the significance level used in the Chi-square test?
-The significance level (alpha) used in the Chi-square test is 5%, or 0.05.
What is the first step in preparing the data for the Chi-square test?
-The first step is to determine the total number of data points, denoted as N, which in this case is 30.
How is the number of classes (intervals) determined for the frequency distribution?
-The number of classes is determined using the formula: 1 + 3.32 * log(N), where N is the number of data points. For this data, it results in 6 classes.
What is the formula used to calculate the class width?
-The class width is calculated by dividing the range (difference between the highest and lowest values) by the number of classes. In this case, the class width is approximately 5.
How is the expected frequency (E) calculated in the Chi-square test?
-The expected frequency is calculated by multiplying the proportion of the total observations that should fall into each class by the total number of observations.
What is the formula used to calculate the Chi-square statistic?
-The Chi-square statistic is calculated using the formula: Σ((O - E)^2 / E), where O is the observed frequency and E is the expected frequency.
What do we do if the Chi-square statistic is less than the critical value from the Chi-square distribution table?
-If the Chi-square statistic is less than the critical value, the null hypothesis (H0) is accepted, meaning the data is considered to follow a normal distribution.
What happens if the Chi-square statistic is greater than the critical value?
-If the Chi-square statistic is greater than the critical value, the null hypothesis (H0) is rejected, and the alternative hypothesis (Ha) is accepted, indicating that the data does not follow a normal distribution.
Outlines

This section is available to paid users only. Please upgrade to access this part.
Upgrade NowMindmap

This section is available to paid users only. Please upgrade to access this part.
Upgrade NowKeywords

This section is available to paid users only. Please upgrade to access this part.
Upgrade NowHighlights

This section is available to paid users only. Please upgrade to access this part.
Upgrade NowTranscripts

This section is available to paid users only. Please upgrade to access this part.
Upgrade Now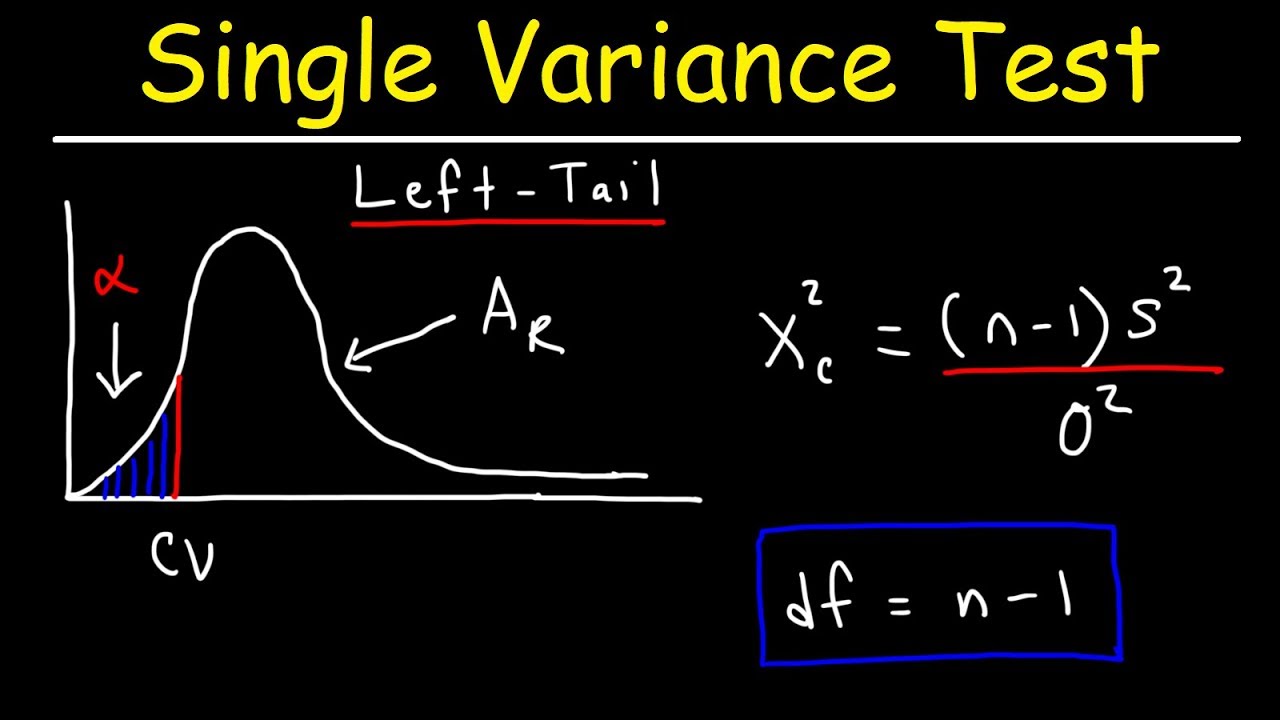


5.0 / 5 (0 votes)