Cuartiles, Deciles y Percentiles | Datos agrupados en intervalos | Ejemplo 2
Summary
TLDRThis video tutorial explains how to calculate quartiles, deciles, and percentiles using grouped frequency tables. The instructor demonstrates step-by-step how to find these measures of position, using a real-life example based on exam scores of 100 students. The video covers key concepts like absolute frequencies, cumulative frequencies, and how to apply the formulas for each measure. The instructor emphasizes the importance of identifying the correct position in the cumulative frequency table, handling cases where values are found directly in the table, and using the right limits and amplitudes for accurate calculations. The tutorial ends with a practical exercise for the viewers to try on their own.
Outlines

This section is available to paid users only. Please upgrade to access this part.
Upgrade NowMindmap

This section is available to paid users only. Please upgrade to access this part.
Upgrade NowKeywords

This section is available to paid users only. Please upgrade to access this part.
Upgrade NowHighlights

This section is available to paid users only. Please upgrade to access this part.
Upgrade NowTranscripts

This section is available to paid users only. Please upgrade to access this part.
Upgrade NowBrowse More Related Video
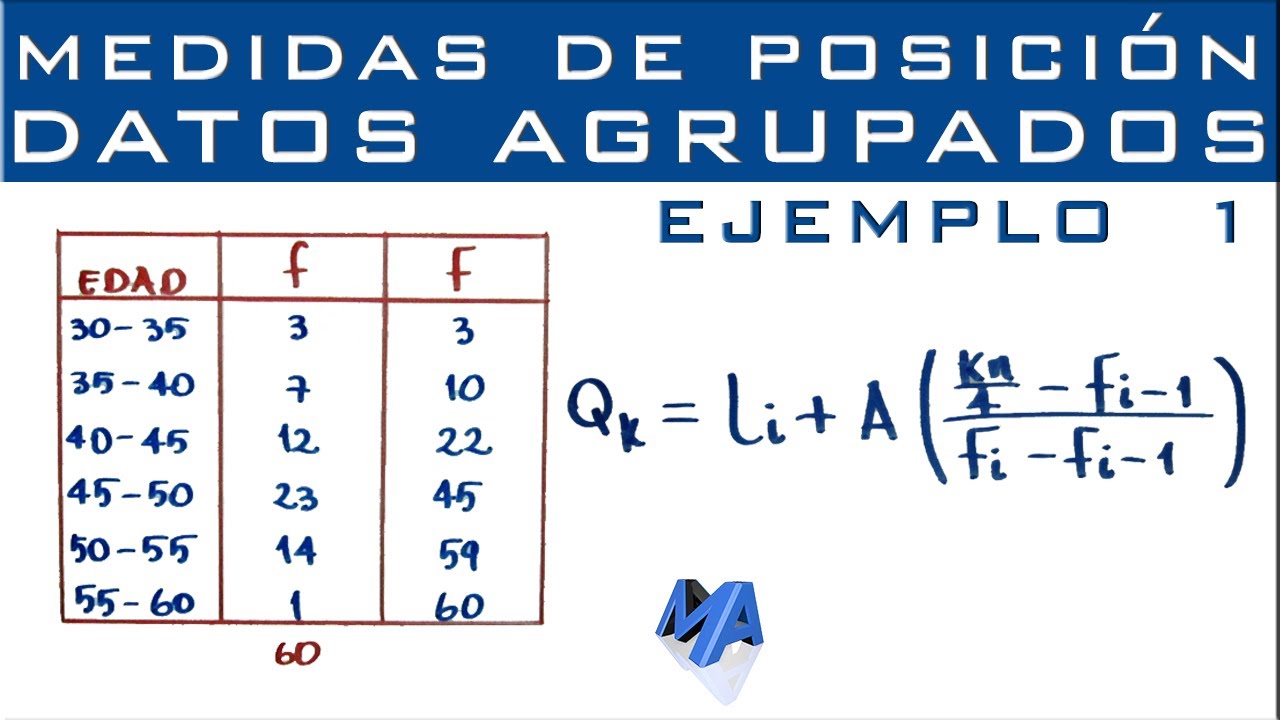
Cuartiles, Deciles y Percentiles | Datos agrupados en intervalos | Ejemplo 1

Statistika Bagian 6 - Persentil Data Tunggal dan Data Kelompok Matematika Wajib Kelas 12
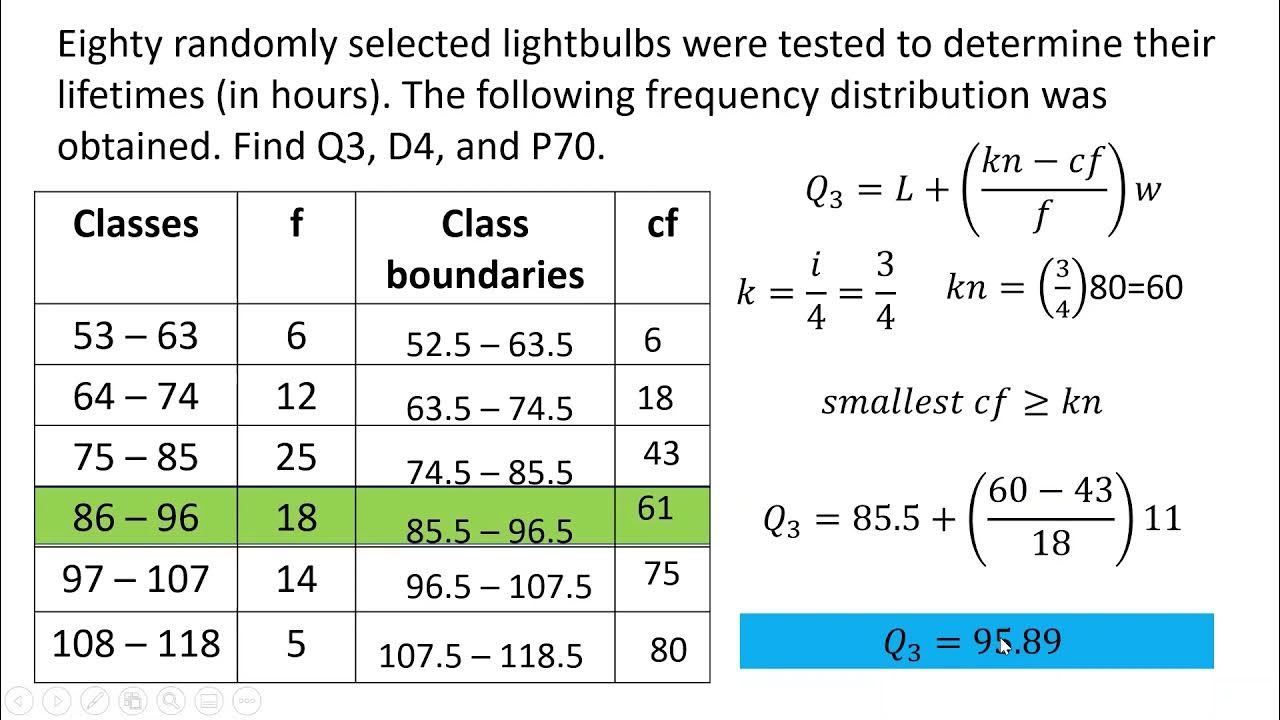
Quartile, Decile and Percentile for grouped data
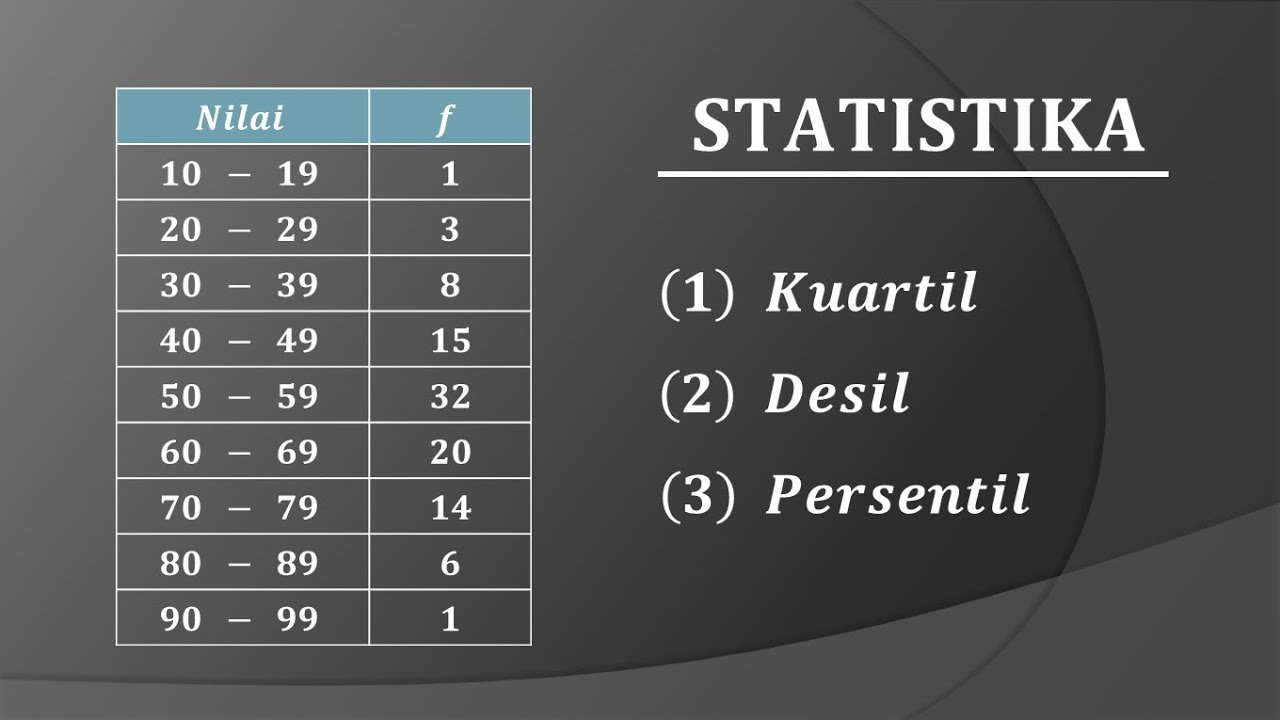
STATISTIKA : Cara mudah menentukan nilai Quartil Desil dan Persentil data kelompok
Ukuran Penyebaran Data : Kuartil, Desil dan Persentil + Contoh Soal

UKURAN PEMUSATAN DATA BERKELOMPOK | Rataan Median Modus Kuartil Desil Persentil
5.0 / 5 (0 votes)