Uji Hipotesis: Lemma Neyman - Pearson (Kuasa Uji)
Summary
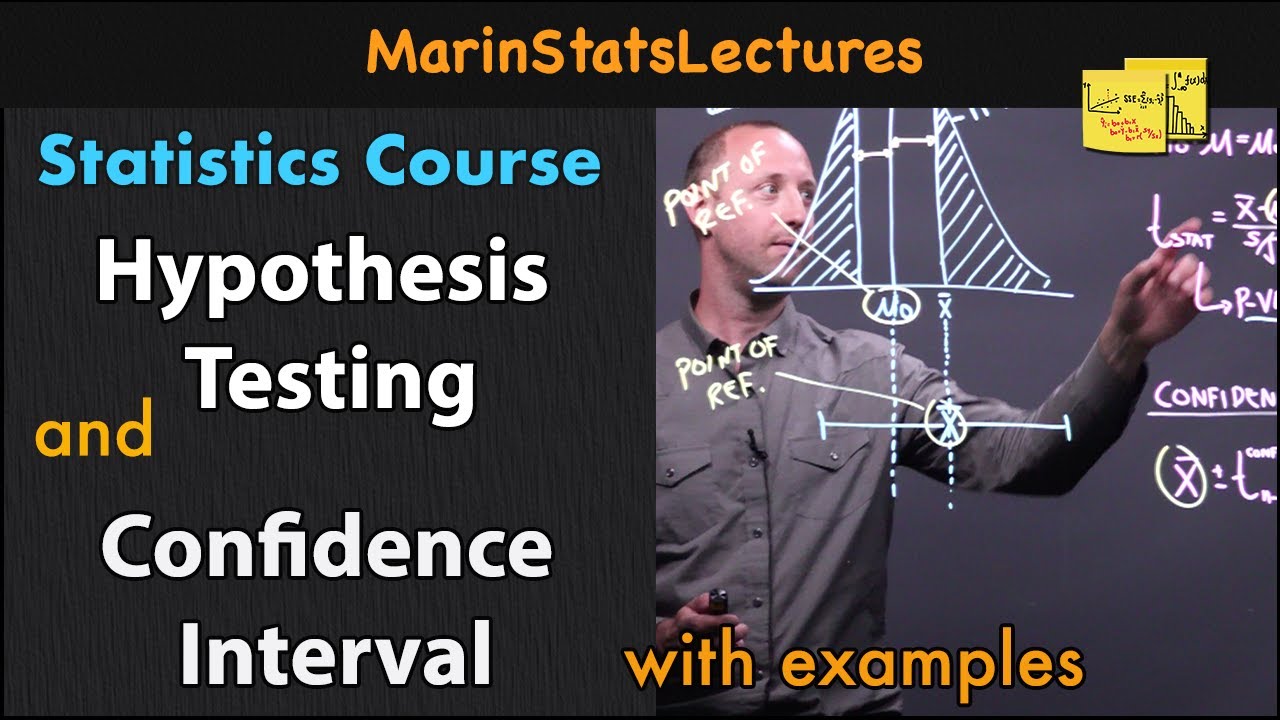
TLDRThis educational video covers hypothesis testing, including the relationship between hypothesis tests and confidence intervals. It explains concepts such as random variables, statistical hypotheses, critical regions, and errors in hypothesis testing. The video explores type I and type II errors, the power of tests, and discusses specific examples of hypothesis testing using various statistical distributions. Additionally, the video touches on methods to determine critical regions and how to assess the effectiveness of a hypothesis test. Overall, it provides a comprehensive understanding of statistical hypothesis testing and its applications.
Takeaways
- 😀 Hypothesis testing involves evaluating statistical statements (hypotheses) about a population based on sample data.
- 😀 There is a strong connection between confidence intervals and hypothesis testing, where the confidence interval can help determine whether a hypothesis should be accepted or rejected.
- 😀 Type I error occurs when we incorrectly reject a true null hypothesis, while Type II error happens when we fail to reject a false null hypothesis.
- 😀 The size of the critical region (or rejection region) in hypothesis testing is crucial to controlling the risk of making Type I errors.
- 😀 The significance level (alpha) represents the probability of making a Type I error, which is set before conducting the test.
- 😀 Statistical power is the probability of correctly rejecting a false null hypothesis, and it is maximized by minimizing Type II errors.
- 😀 The function of power (or test power) in hypothesis testing represents the ability of a test to correctly identify an effect when there is one.
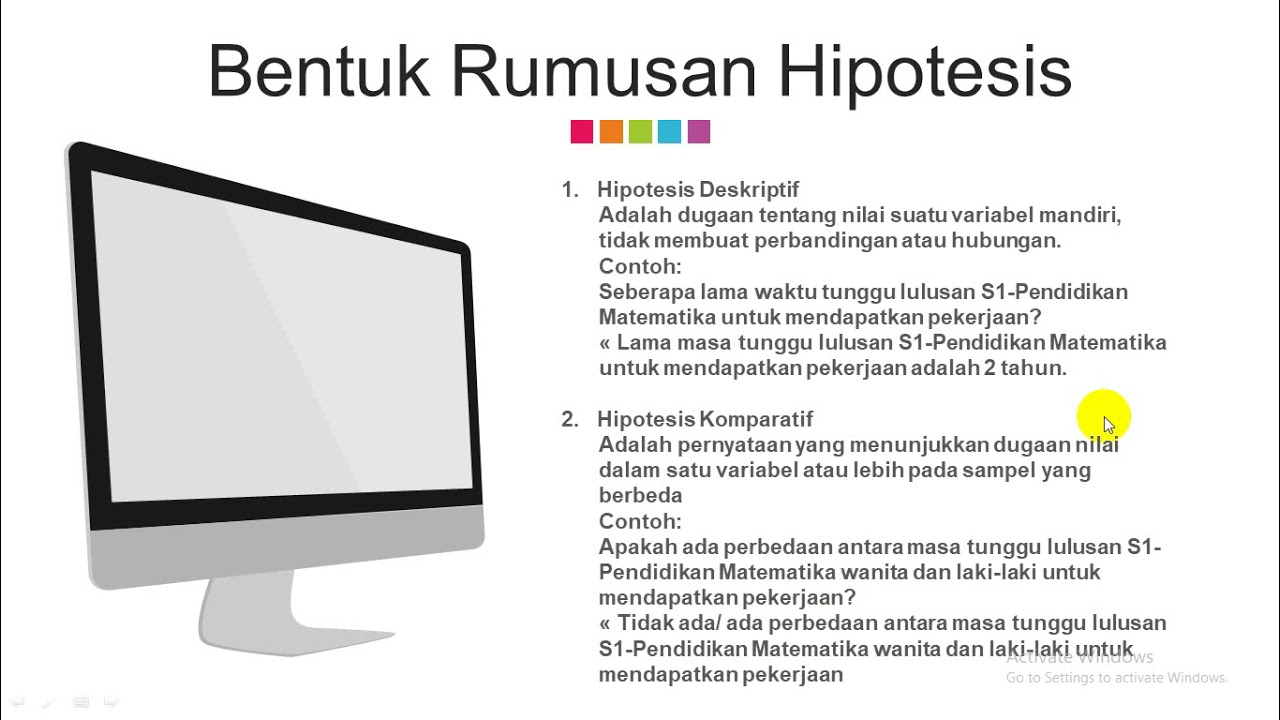
- 😀 Hypotheses are typically framed as null (H0) and alternative (H1), and the decision to reject or fail to reject the null hypothesis is based on the sample data.
- 😀 The t-test is a common statistical test used for hypothesis testing, especially for comparing means when the population variance is unknown.
- 😀 The relationship between the test statistic (such as the t-statistic) and the critical value helps in determining the outcome of the hypothesis test, i.e., whether to reject H0 or not.
Q & A
What is the relationship between confidence intervals and hypothesis testing?
-Confidence intervals and hypothesis testing are closely related. In hypothesis testing, a parameter is tested based on a given assumption (hypothesis). A confidence interval provides a range of values within which the parameter is likely to lie with a certain level of confidence. If the value of the hypothesized parameter falls outside the confidence interval, it is rejected; otherwise, the hypothesis is not rejected.
What are Type I and Type II errors in hypothesis testing?
-In hypothesis testing, a Type I error occurs when the null hypothesis (H0) is rejected when it is actually true. A Type II error occurs when the null hypothesis is not rejected when it is actually false. The probability of making a Type I error is denoted by alpha (α), while the probability of making a Type II error is denoted by beta (β).
What is the significance of the critical region in hypothesis testing?
-The critical region in hypothesis testing is a range of values for which the null hypothesis (H0) is rejected. The boundaries of the critical region are determined by the significance level (alpha, α), which specifies the probability of making a Type I error. If the test statistic falls within the critical region, the null hypothesis is rejected.
How does the power of a test relate to the Type II error?
-The power of a test is the probability that the test correctly rejects the null hypothesis when the alternative hypothesis is true. The power is related to Type II error (β), as increasing the power of a test decreases the probability of making a Type II error. A powerful test reduces the likelihood of failing to reject a false null hypothesis.
What does it mean for a hypothesis to be 'simple' or 'composite'?
-A simple hypothesis specifies the exact distribution or parameter value of a population, while a composite hypothesis specifies a range of possible values or distributions for the parameter. A simple hypothesis is precise, whereas a composite hypothesis is more general.
How do we determine the size of the critical region?
-The size of the critical region is determined by the significance level (alpha, α) of the test. It represents the probability of rejecting the null hypothesis when it is actually true. The critical region is chosen such that the probability of Type I error is limited to the significance level.
What is the purpose of the test statistic in hypothesis testing?
-The test statistic is used to assess the evidence against the null hypothesis. It is a standardized value that is calculated from the sample data. The value of the test statistic is compared with the critical value to determine whether to reject or fail to reject the null hypothesis.
What is the role of the significance level (alpha) in hypothesis testing?
-The significance level (alpha, α) represents the threshold for deciding whether the observed data is consistent with the null hypothesis. It defines the probability of committing a Type I error, i.e., rejecting the null hypothesis when it is actually true. A smaller alpha value reduces the likelihood of a Type I error but increases the risk of a Type II error.
How do you interpret the power of a test?
-The power of a test is the probability of correctly rejecting the null hypothesis when it is false. A high power indicates that the test is effective at detecting a true effect when one exists. Power is calculated as 1 minus the probability of a Type II error (β).
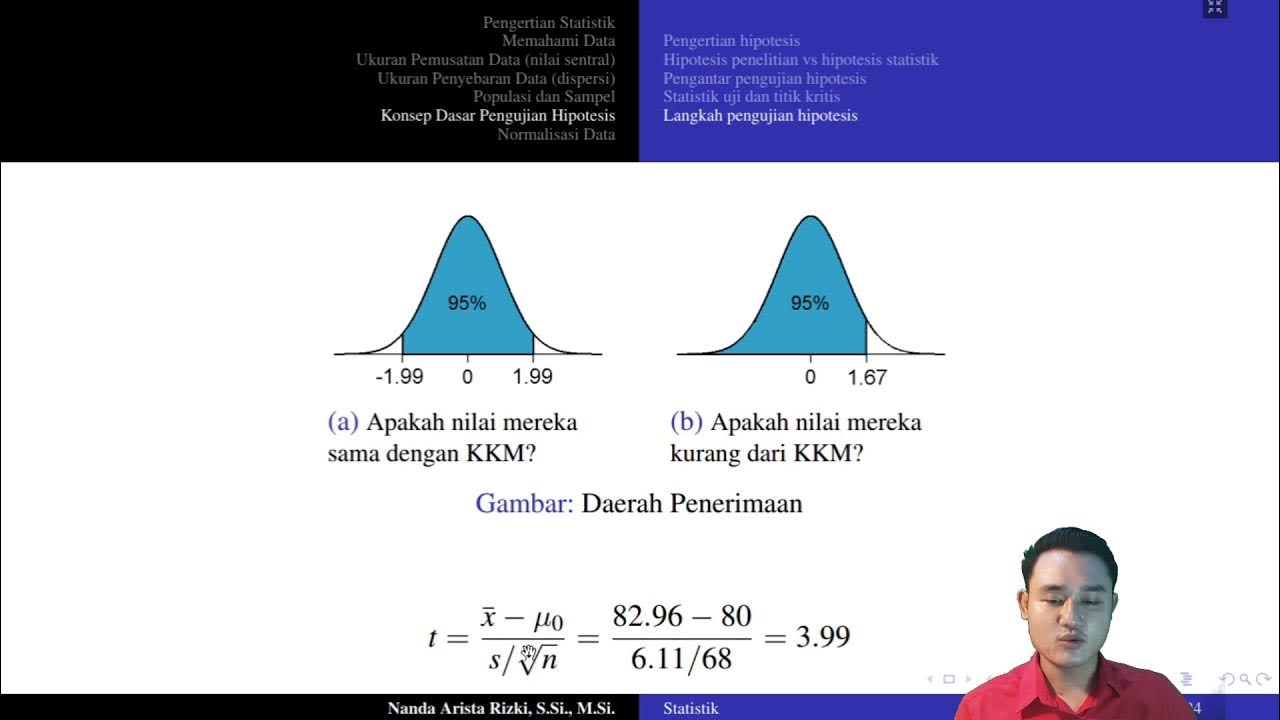
What is the difference between a one-tailed and a two-tailed hypothesis test?
-In a one-tailed hypothesis test, the critical region is located on one side of the sampling distribution, either to the left or right of the mean, depending on the alternative hypothesis. In a two-tailed test, the critical region is split across both sides of the sampling distribution, allowing for the possibility of an effect in either direction. A two-tailed test is used when we are interested in deviations in both directions from the null hypothesis.
Outlines

This section is available to paid users only. Please upgrade to access this part.
Upgrade NowMindmap

This section is available to paid users only. Please upgrade to access this part.
Upgrade NowKeywords

This section is available to paid users only. Please upgrade to access this part.
Upgrade NowHighlights

This section is available to paid users only. Please upgrade to access this part.
Upgrade NowTranscripts

This section is available to paid users only. Please upgrade to access this part.
Upgrade NowBrowse More Related Video
Hypothesis Test vs. Confidence Interval | Statistics Tutorial #15 | MarinStatsLectures
Konsep Dasar Pengujian Hipotesis
Metode Statistika | Uji Hipotesis bagi Rata-rata Satu Populasi
Masih berpikir bahwa hipotesis statistik itu membingungkan? | Statistika
Statistical Inference Definition with Example | Statistics Tutorial #18 | MarinStatsLectures

Materi Konsep Dasar Pengujian Hipotesis
5.0 / 5 (0 votes)