Matematika Kelas 8: Statistika | Mean, Median, Modus, Kuartil, Jangkauan
Summary
TLDRThis educational video for 8th-grade students covers fundamental concepts in statistics, including the differences between datum and data, and explains how to calculate the mean, median, mode, quartiles, and range. The instructor uses clear examples to illustrate each concept, such as finding the average of test scores or identifying the most frequent score in a dataset. Emphasizing accuracy, the video guides students through the correct methods to handle data and perform calculations, making it easier for them to understand these essential statistical techniques.
Takeaways
- 😀 Datum refers to a single piece of information, while data is a collection of multiple datum.
- 😀 The mean is the average of a data set and can be calculated using two formulas: one for simple data and one for data with frequencies.
- 😀 To calculate the mean of a simple data set, sum all the values and divide by the total number of data points.
- 😀 When data includes frequencies, the formula for the mean adjusts to account for the weight of each data point.
- 😀 Median represents the middle value in a data set when arranged in order, and special care is needed when the data set has an even number of values.
- 😀 For calculating the median, sort the data first, and if there is an even number of data points, find the average of the two middle values.
- 😀 Mode is the most frequent value in a data set, and it is easily identified by counting the frequency of each value.
- 😀 Quartiles divide a data set into four equal parts, with Q1 being the 25th percentile, Q2 the 50th percentile (median), and Q3 the 75th percentile.
- 😀 To find Q1 and Q3, first calculate the median, then apply the median formula to the lower and upper halves of the data set.
- 😀 Range is the difference between the largest and smallest values in a data set, calculated by subtracting the smallest value from the largest.
Q & A
What is the difference between 'data' and 'datum'?
-'Datum' refers to a single piece of information or observation, which can be a number or not. 'Data' is a collection of these individual pieces of information. For example, individual names like Udin or Dadang are datum, whereas the group of students like Udin, Dadang, Parjo, and Tukiyem are data.
How is the mean calculated for a dataset without frequency distribution?
-The mean is calculated by summing all the data points (X1 + X2 + X3 + ... + Xn) and dividing the result by the total number of data points (n). The formula is: Mean (X̄) = (X1 + X2 + ... + Xn) / n.
What formula is used to calculate the mean when frequencies are given?
-When frequencies are given, the mean is calculated using the formula: Mean (X̄) = (F1 * X1 + F2 * X2 + ... + Fn * Xn) / (F1 + F2 + ... + Fn), where F1, F2, ..., Fn represent the frequencies of the respective data points.
How do you calculate the mean for a dataset with raw scores (without frequency distribution)?
-You simply add up all the data points, then divide by the total number of data points. For example, if you have test scores like 60, 70, 80, and 90, you would add them up (60 + 70 + 80 + 90 = 300) and divide by the number of data points (4), resulting in a mean of 75.
What is the median, and how is it found in a dataset?
-The median is the middle value in a dataset when the data is ordered from smallest to largest. If the number of data points is odd, the median is the middle number. If it’s even, the median is the average of the two middle numbers.
How do you calculate the median for an odd number of data points?
-For an odd number of data points, you first arrange the data in ascending order, then the median is the data point that falls exactly in the middle of the list. For example, if you have 19 data points, the median is the 10th value.
What happens when there is an even number of data points while calculating the median?
-When there is an even number of data points, the median is calculated by averaging the two middle numbers. For example, if there are 20 data points, the median will be the average of the 10th and 11th values in the ordered list.
What is the mode, and how is it identified in a dataset?
-The mode is the value that appears most frequently in a dataset. It is identified by checking which value occurs the most. For example, if you have test scores where 80 appears six times, 80 is the mode.
What is the range in statistics, and how is it calculated?
-The range is the difference between the highest and lowest values in a dataset. It is calculated by subtracting the smallest value from the largest value. For example, if the highest score is 100 and the lowest is 50, the range is 100 - 50 = 50.
What is a quartile in statistics, and how is it different from the median?
-A quartile divides a dataset into four equal parts. The first quartile (Q1) is the median of the lower half of the data, the second quartile (Q2) is the overall median, and the third quartile (Q3) is the median of the upper half of the data. The median itself is a specific type of quartile (Q2).
Outlines

This section is available to paid users only. Please upgrade to access this part.
Upgrade NowMindmap

This section is available to paid users only. Please upgrade to access this part.
Upgrade NowKeywords

This section is available to paid users only. Please upgrade to access this part.
Upgrade NowHighlights

This section is available to paid users only. Please upgrade to access this part.
Upgrade NowTranscripts

This section is available to paid users only. Please upgrade to access this part.
Upgrade NowBrowse More Related Video
Kurikulum Merdeka Matematika Kelas 8 Bab 6 Statistika

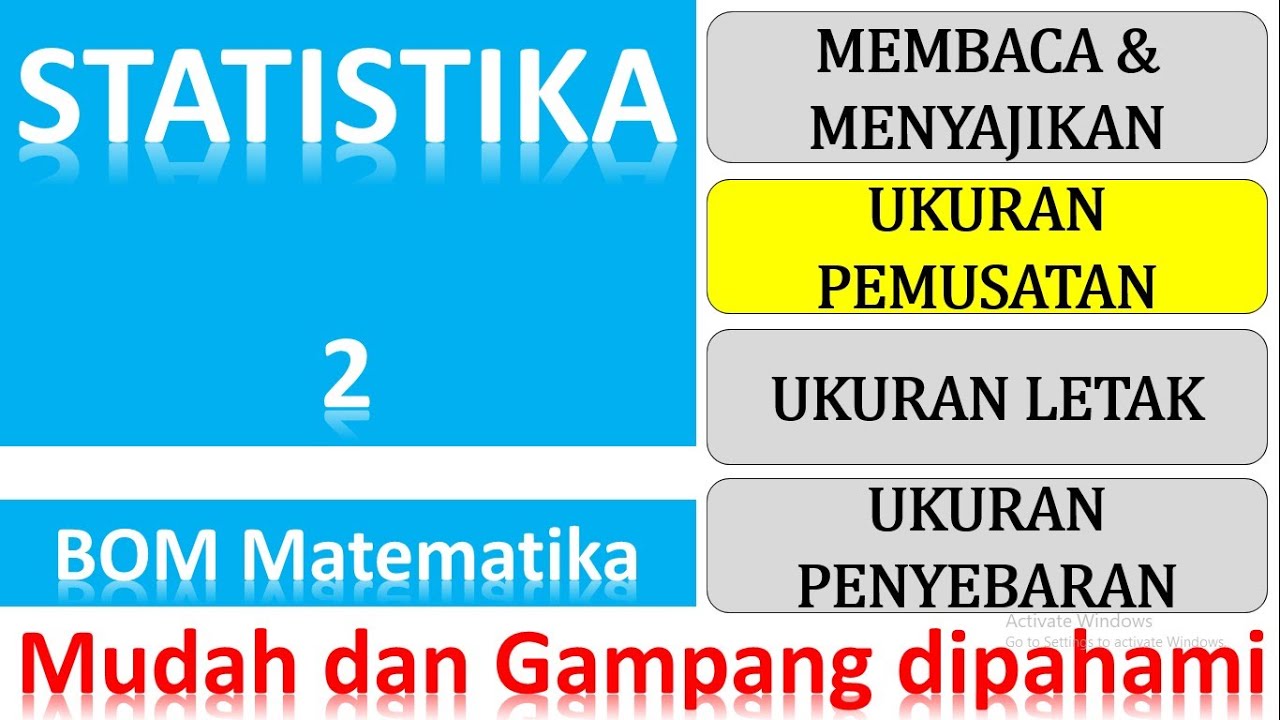
Ukuran Pemusatan Data (Mean, Median, Modus dan Kuartil) - STATISTIKA Kelas 8
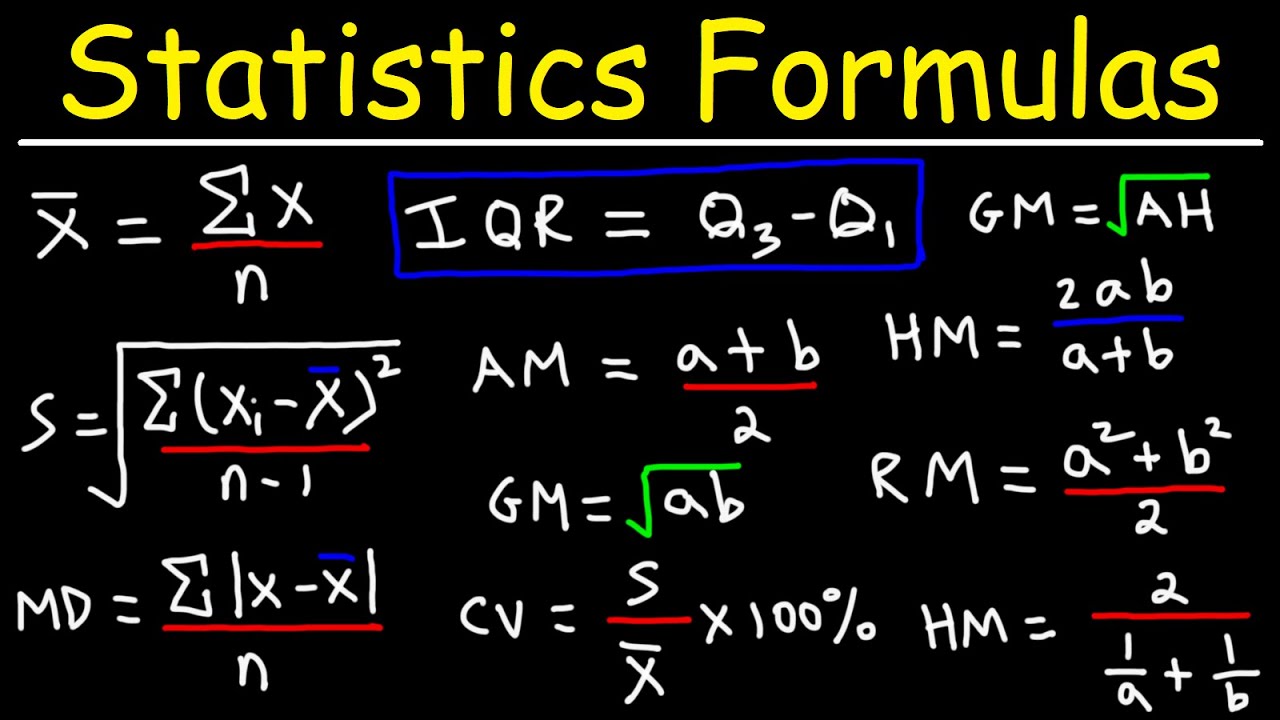
Statistics - Formulas and Equations

Ukuran Penyebaran Data | Statistika Kelas 8
Ukuran pemusatan data, mean median modus, Statistika
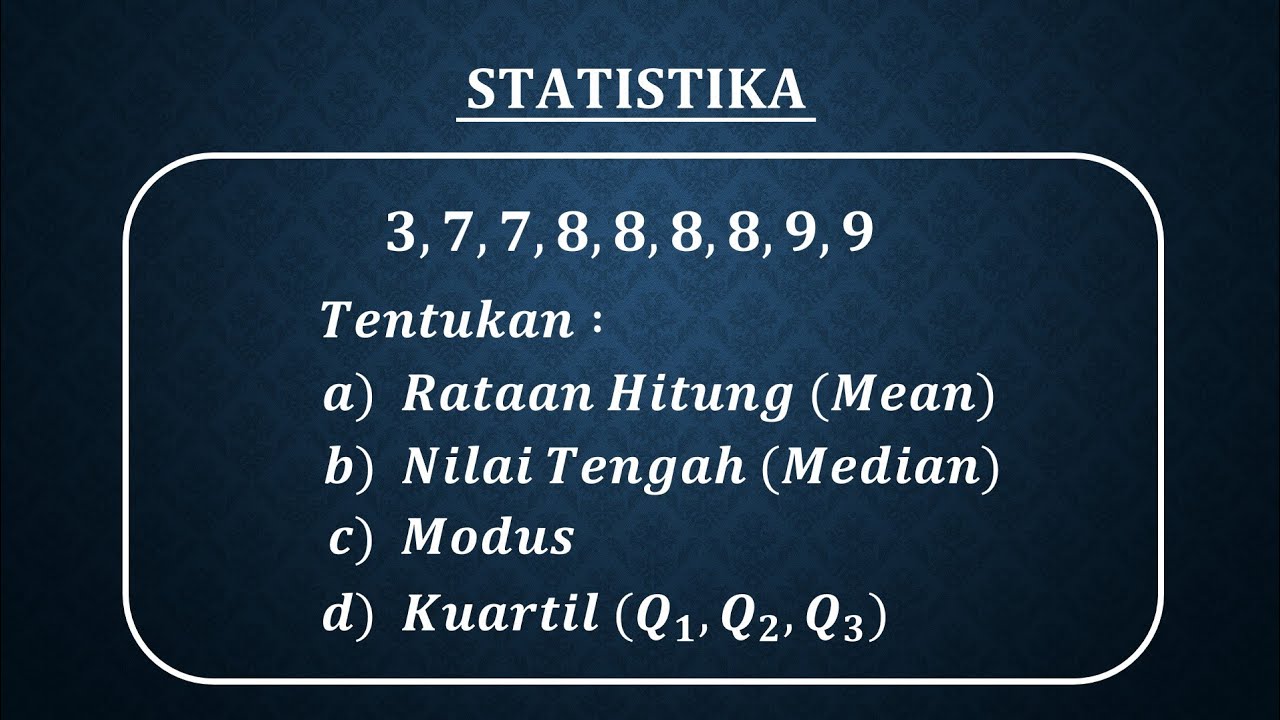
STATISTIKA Tentang Mean, Median, Modus dan Kuartil Data Tunggal
5.0 / 5 (0 votes)