Ukuran Pemusatan Data (Mean, Median, Modus dan Kuartil) - STATISTIKA Kelas 8
Summary
TLDRIn this educational video on statistics for Grade 8, key concepts like mean, median, mode, and quartiles are explained with practical examples. The video covers how to calculate the mean (average), find the median (middle value), and identify the mode (most frequent value) in a data set. The instructor also demonstrates how to compute quartiles to divide data into four equal parts. Through simple explanations and step-by-step solutions, viewers learn how to apply these statistical methods to both individual and grouped data, enhancing their understanding of data analysis.
Takeaways
- 😀 Statistics is the science of collecting, organizing, analyzing, and interpreting data to make accurate conclusions.
- 😀 The first topic in statistics for 8th-grade students is data presentation, which was covered in the previous year.
- 😀 The second topic is measures of central tendency, with the focus on mean (average), which is calculated by dividing the sum of all data by the number of data points.
- 😀 A practical example for calculating the mean is shown using exam scores: the sum of the data (78) is divided by the number of students (12) to get a mean of 6.5.
- 😀 In a real-world scenario, the mean can be used to determine unknown values, such as the score of a student (Ani) based on the overall class average.
- 😀 The second measure of central tendency discussed is the median, which is the middle value in a sorted data set. If there is an even number of data points, the median is the average of the two middle numbers.
- 😀 In an example with even-numbered data, the median is found by averaging the two middle values (6 and 6), resulting in a median of 6.
- 😀 For odd-numbered data, the median is simply the middle number when the data is ordered.
- 😀 The mode is the third measure of central tendency, which is the most frequent value in a data set. In the example, the number 6 appears the most, making it the mode.
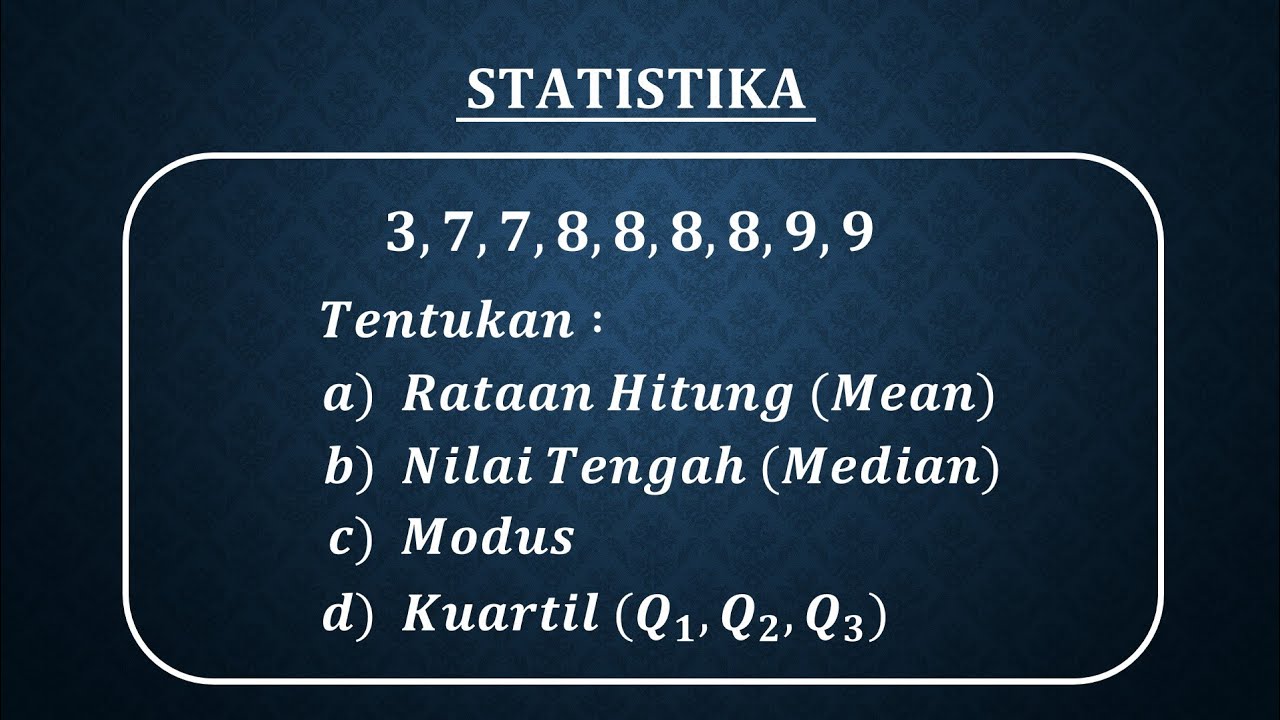
- 😀 Quartiles divide data into four equal parts. The first quartile (Q1) is the median of the lower half of the data, Q2 is the median of the entire data set, and Q3 is the median of the upper half.
- 😀 A final example shows how to find Q1, Q2, and Q3 using a sorted data set, demonstrating the process of finding these quartiles step by step.
Q & A
What is the main focus of the video?
-The video focuses on the topic of statistics, particularly on data collection, data organization, data presentation, data analysis, and drawing conclusions in a precise manner. The main emphasis in this video is on measures of central tendency, specifically the mean, median, and mode.
What is the first topic discussed in the video?
-The first topic discussed is 'Measures of Central Tendency', which includes the mean (average), median (middle value), and mode (most frequent value). The video begins by explaining the concept of the mean.
How is the mean calculated from the given data in the video?
-The mean is calculated by adding up all the data points and dividing by the total number of data points. In the example provided, the sum of the data values is divided by the number of data points to calculate the average.
What was the mean of the given data set in the video?
-The mean of the given data set was calculated as 6.5, based on the sum of the data points divided by the total number of data points.
How is the average score of Ani determined in the example?
-To find Ani's score, the formula for calculating the mean is applied. The average score of the 39 students is multiplied by 39, and Ani's score is added to this sum. The result is then divided by the total number of students (40), which leads to the calculation that Ani's score is 85.
What is the median, and how is it calculated?
-The median is the middle value of a data set. If the number of data points is odd, the median is the single middle value. If the number is even, the median is the average of the two middle values. In the video, an example was provided where the median of an ordered data set was found to be 6.
How is the median determined when the data set contains an even number of elements?
-When the data set has an even number of elements, the median is calculated by averaging the two middle values. For example, in the video, a data set with 12 values had a median calculated as the average of the 6th and 7th values, which resulted in a median of 6.
What is the mode in statistics?
-The mode is the value that appears most frequently in a data set. In the video, the mode was determined to be 6, as it occurred the most frequently in the data set provided.
What are quartiles, and how are they calculated?
-Quartiles divide a data set into four equal parts. The first quartile (Q1) is the median of the lower half of the data, the second quartile (Q2) is the median of the entire data set, and the third quartile (Q3) is the median of the upper half. The video demonstrated how to find these quartiles with examples.
How are Q1, Q2, and Q3 determined from the data?
-To find Q1, Q2, and Q3, the data must first be ordered. Q2 is simply the median of the entire data set. Q1 is the median of the lower half of the data, and Q3 is the median of the upper half. The video explained how to determine these values step by step using example data.
Outlines

This section is available to paid users only. Please upgrade to access this part.
Upgrade NowMindmap

This section is available to paid users only. Please upgrade to access this part.
Upgrade NowKeywords

This section is available to paid users only. Please upgrade to access this part.
Upgrade NowHighlights

This section is available to paid users only. Please upgrade to access this part.
Upgrade NowTranscripts

This section is available to paid users only. Please upgrade to access this part.
Upgrade NowBrowse More Related Video
Kuliah Statistika Terapan - Pemusatan Data Sesi 1 Ep.04
STATISTIKA Tentang Mean, Median, Modus dan Kuartil Data Tunggal

Ringkasan Materi Statistika kelas 8 Genap

Menentukan Kuartil Q1 Q2 Q3 Median Mean Modus Statistika kelas 12
Kurikulum Merdeka Matematika Kelas 8 Bab 6 Statistika
STATISTIKA (MEAN,MEDIAN,MODUS DAN STATISTK LIMA SERANGKAI)
5.0 / 5 (0 votes)