ANALISA TEKNIKAL XAUUSD 24-28 MARET 2025 #analisateknikal #gold #xauusd #trump #forecast ATH GOLD
Summary
TLDRIn this video, Johan from Juna Trading ID analyzes the movement of Gold (XAU/USD) using Open Interest (OI) and Commitment of Traders (COT) data. He discusses recent price fluctuations, highlighting key support and resistance levels, including potential breakout points. Johan also emphasizes the importance of using these data points for making informed trading decisions and shares his insights on the market's current bullish sentiment. With a focus on key technical levels, the video offers strategies for both buying and selling based on OI and COT analysis.
Takeaways
- 😀 Gold's recent price range was between 3023 and 3026 with support, and resistance was around 3034 to 3037.
- 😀 The price of gold dropped to 3000, as predicted in last Friday's video, and this decline aligns with the target based on Open Interest data.
- 😀 The Open Interest data showed no significant buying activity above the 3500 level, signaling a lack of bullish momentum at those prices.
- 😀 After dropping to 3000, gold prices rebounded to the 3200 range, confirming a potential for further price movement.
- 😀 A Head and Shoulders (HNS) pattern was identified on the chart, indicating potential further downside towards 2995 and 2982.
- 😀 If gold breaks above the 3026 level, there is potential for a move back to the 3037-3055 range, with further upside potential if 3055 is cleared.
- 😀 Intraday support is at 3000, and a break below this level may lead to further declines towards the 2982 range.
- 😀 If gold breaks the 3026 resistance level, traders should look for buy opportunities with targets of 3037, 3050, and beyond.
- 😀 COT data reveals that long positions are accumulating, suggesting a bullish bias for gold, while short positions are decreasing.
- 😀 The Open Interest data shows that the accumulation zone for gold is between 3300 and 3150, with further downside risk to 2950-2945 if 3000 breaks.
Q & A
What is the main topic discussed in the video?
-The main topic discussed in the video is the technical analysis of gold (Exo USD) price movements, focusing on support and resistance levels, as well as open interest (OI) and commitment of traders (COT) data.
What are the key resistance and support levels for gold mentioned in the video?
-The key resistance levels for gold are between 3034 to 3037, and the support levels are between 3023 to 3026. Additionally, a significant support level at 3000 is mentioned.
What is the significance of the 3000 price point for gold?
-The 3000 price point is considered a key support level for gold. The speaker mentions that if gold breaks below this level, it could potentially drop further.
What role does open interest (OI) data play in the analysis?
-Open interest (OI) data is used to determine market sentiment and potential price movements. The speaker highlights that when there are no buyers above the 3500 price point, it indicates a bearish sentiment, as seen when the price dropped to 3000.
What are the potential price targets for gold based on the open interest data?
-The potential price targets mentioned for gold based on the open interest data are 3000, 2995, 2982 as lower targets, and 3045, 3055, 3070 as higher targets if the price breaks above resistance levels.
What is the significance of the Head and Shoulders (HNS) pattern in the analysis?
-The Head and Shoulders (HNS) pattern is identified as a bearish reversal pattern. The speaker notes that the price dropped after breaking out from the support, following the HNS pattern.
What does the speaker suggest doing if the price breaks above the 37 level?
-If the price breaks above the 37 resistance level, the speaker suggests considering a buy position with target prices ranging from 45 to 53, potentially up to 65-70.
What does the COT data suggest about gold’s price trend?
-The COT data suggests that gold is in a bullish trend, as long positions have increased significantly, indicating buyer accumulation. Short positions, on the other hand, have decreased.
What is the advice regarding trading when the price is below 3026?
-When the price is below 3026, the speaker suggests considering it a sell zone, and advises trading with caution as the market is in a bearish phase.
How does the speaker describe the potential for a price movement below 3000?
-The speaker mentions that if the price breaks below 3000, it could continue to decline towards 2970, 2950, or even 2945 as extreme targets. However, if the price stays above 3000, there is a possibility for a reversal upwards.
Outlines

This section is available to paid users only. Please upgrade to access this part.
Upgrade NowMindmap

This section is available to paid users only. Please upgrade to access this part.
Upgrade NowKeywords

This section is available to paid users only. Please upgrade to access this part.
Upgrade NowHighlights

This section is available to paid users only. Please upgrade to access this part.
Upgrade NowTranscripts

This section is available to paid users only. Please upgrade to access this part.
Upgrade NowBrowse More Related Video
ANALISA NFP TEKNIKAL XAUUSD 7 FEBRUARI 2025 #analisateknikal #gold #xauusd #trump #forecast #nfp

How to Trade Using CVD Divergences | Day Trading Guide

SCALPING XAUUSD WIN RATE TINGGI DENGAN 1 POLA INI
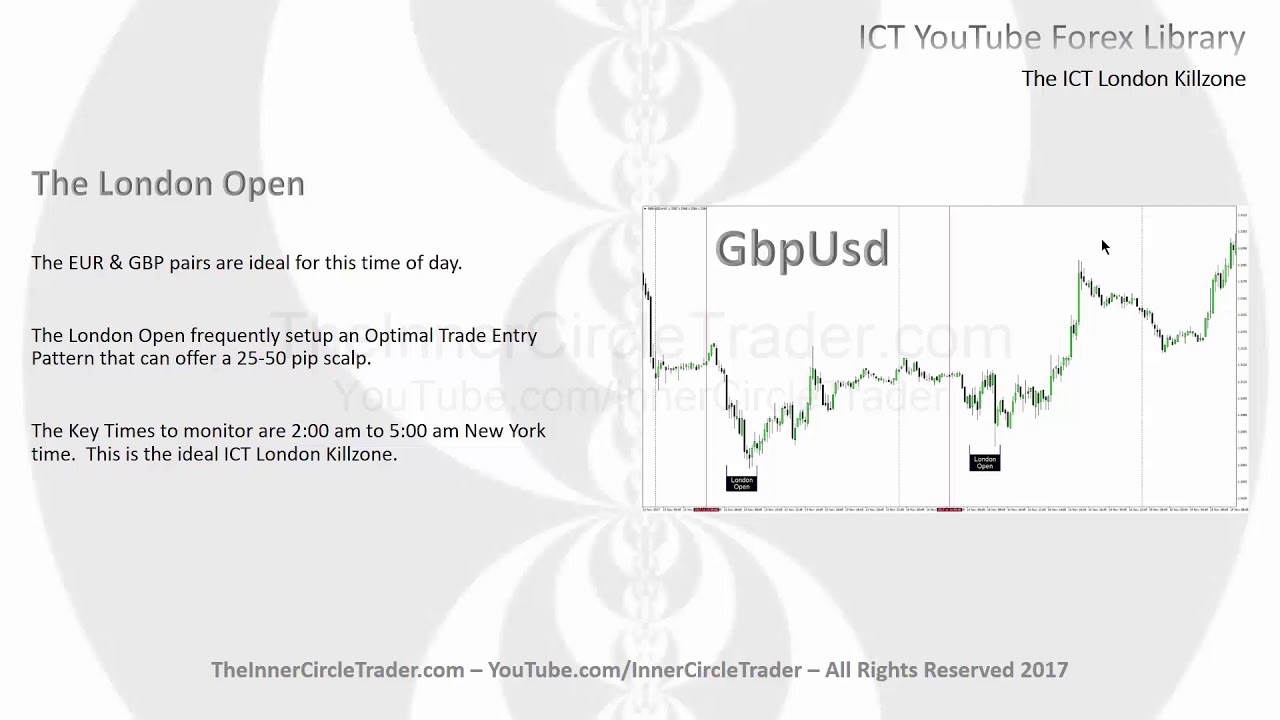
ICT Forex - The ICT London Killzone

ICT Charter Price Action Model #4 Position Trading
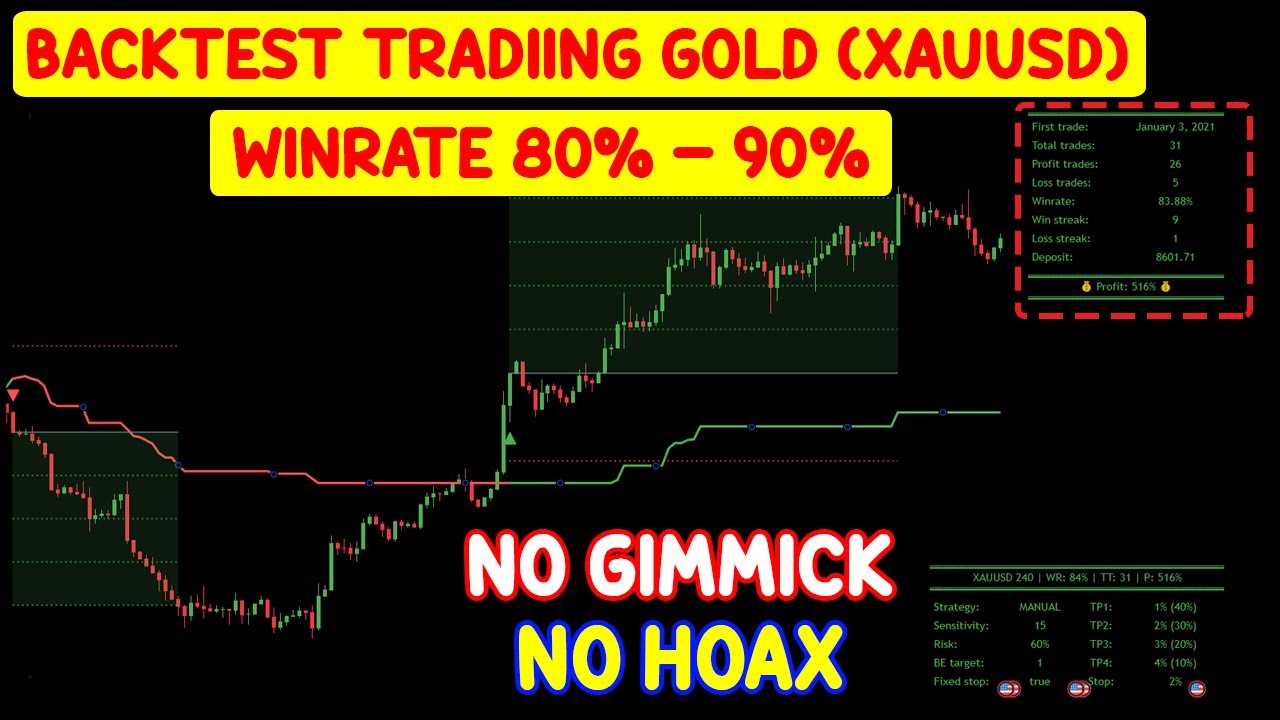
Backtest Trading Gold (XAUUSD) Winrate 80% - 90% No Gimmick & No Hoax | Swing Trading | Day Trading
5.0 / 5 (0 votes)