Spearman Rank Correlation [Simply explained]
Summary
TLDRThe video script explains the concept of Spearman's rank correlation, a non-parametric method to measure the relationship between two variables using their ranks instead of raw data. It contrasts this with Pearson correlation and demonstrates the process through an example involving reaction times and ages of computer players. The script also covers how to calculate Spearman's correlation coefficient, interpret its strength and direction, and use a t-test to determine if the correlation is significantly different from zero, as illustrated with a dataset provided in the video description.
Takeaways
- 📊 Spearman correlation is a non-parametric statistical measure used to assess the strength and direction of the relationship between two variables.
- 🔄 Unlike Pearson correlation, Spearman correlation does not use the raw data but instead uses the ranks of the data.
- 🎯 In the example provided, reaction time and age of computer players are ranked to calculate Spearman correlation.
- 📈 The Spearman rank correlation coefficient is calculated using the ranks of the data, similar to the Pearson correlation but with ranks.
- 📉 The Spearman correlation coefficient, 'rs', ranges from -1 to 1, indicating the strength and direction of the relationship between variables.
- 🔢 The formula for Spearman correlation involves summing the squares of the differences in ranks (D) and is applicable when there are no rank ties.
- 📝 The correlation coefficient can be used to interpret the strength of the relationship: negative values indicate a negative correlation, positive values a positive correlation, and zero indicates no correlation.
- ✅ A hypothesis test can be conducted to determine if the correlation coefficient is significantly different from zero, using a t-test and comparing the p-value to a significance level.
- 📉 The null hypothesis states that there is no relationship (correlation coefficient equals zero), while the alternative hypothesis suggests there is a relationship.
- 📊 The significance of the correlation can be assessed using a t-test statistic, where a p-value less than the significance level (commonly 0.05) leads to the rejection of the null hypothesis.
- 🔗 Data from the example in the script yields a p-value of 0.002, which is less than 0.05, indicating a significant correlation and rejection of the null hypothesis.
Q & A
What is the Spearman correlation?
-The Spearman correlation, also known as Spearman's rank correlation, is a non-parametric measure of rank correlation that assesses how well the relationship between two variables can be described using a monotonic function.
How does Spearman correlation differ from Pearson correlation?
-While both Spearman and Pearson correlations measure the strength and direction of the relationship between two variables, Spearman correlation uses the ranks of the data instead of the raw data, making it a non-parametric alternative to the Pearson correlation which requires normally distributed data.
What is the process of calculating Spearman rank correlation?
-To calculate the Spearman rank correlation, first assign ranks to the data points for each variable. Then, calculate the difference in ranks for each pair of data points, square these differences, sum them up, and divide by the number of observations to find the Spearman correlation coefficient.
How are ranks assigned to the data in Spearman correlation?
-Ranks are assigned based on the order of the data points. The smallest value gets rank 1, the next smallest gets rank 2, and so on. If there are ties, assign the average rank to the tied values.
What does a Spearman correlation coefficient value of 0.9 indicate?
-A Spearman correlation coefficient of 0.9 indicates a very strong positive relationship between the two variables, meaning that as one variable increases, the other tends to increase as well.
What is the range of the Spearman correlation coefficient?
-The Spearman correlation coefficient ranges from -1 to 1, where -1 indicates a perfect negative relationship, 1 indicates a perfect positive relationship, and 0 indicates no relationship.
How can you determine if a Spearman correlation coefficient is statistically significant?
-To determine if a Spearman correlation coefficient is statistically significant, you can use a t-test. If the calculated p-value is less than the significance level (commonly 0.05), the null hypothesis that there is no relationship is rejected.
What is the null hypothesis in a Spearman correlation test?
-The null hypothesis in a Spearman correlation test is that the correlation coefficient (ρ) is equal to zero, indicating no relationship between the two variables.
What is the alternative hypothesis in a Spearman correlation test?
-The alternative hypothesis in a Spearman correlation test is that the correlation coefficient (ρ) is not equal to zero, indicating that there is a relationship between the two variables.
Can the Spearman correlation be used with non-normally distributed data?
-Yes, the Spearman correlation is particularly useful with non-normally distributed data or ordinal data because it does not assume normality and is based on the ranks of the data rather than the actual values.
How does the presence of outliers affect the Spearman correlation?
-Since Spearman correlation is based on ranks, it is less affected by outliers compared to the Pearson correlation, which is sensitive to extreme values in the data.
Outlines

This section is available to paid users only. Please upgrade to access this part.
Upgrade NowMindmap

This section is available to paid users only. Please upgrade to access this part.
Upgrade NowKeywords

This section is available to paid users only. Please upgrade to access this part.
Upgrade NowHighlights

This section is available to paid users only. Please upgrade to access this part.
Upgrade NowTranscripts

This section is available to paid users only. Please upgrade to access this part.
Upgrade NowBrowse More Related Video
Spearmen's Rank Correlation || Gnani The Knowledge ||
Kendall's Tau [Easily explained]
What is the difference between parametric and nonparametric hypothesis testing?

Week 5-Lecture 33 : Spearman’s Rank Correlation.
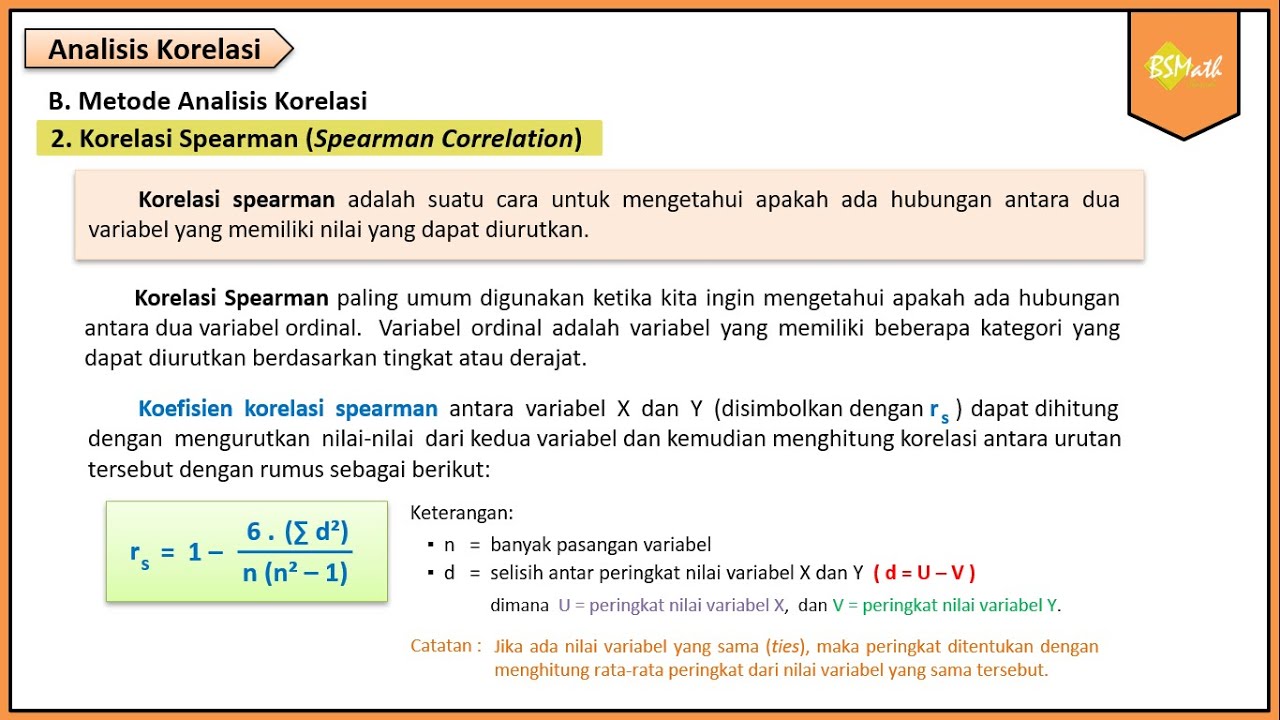
Korelasi Spearman - Matematika Wajib SMA Kelas XI Kurikulum Merdeka

A-Level Biology - Spearman's rank correlation coefficient
5.0 / 5 (0 votes)