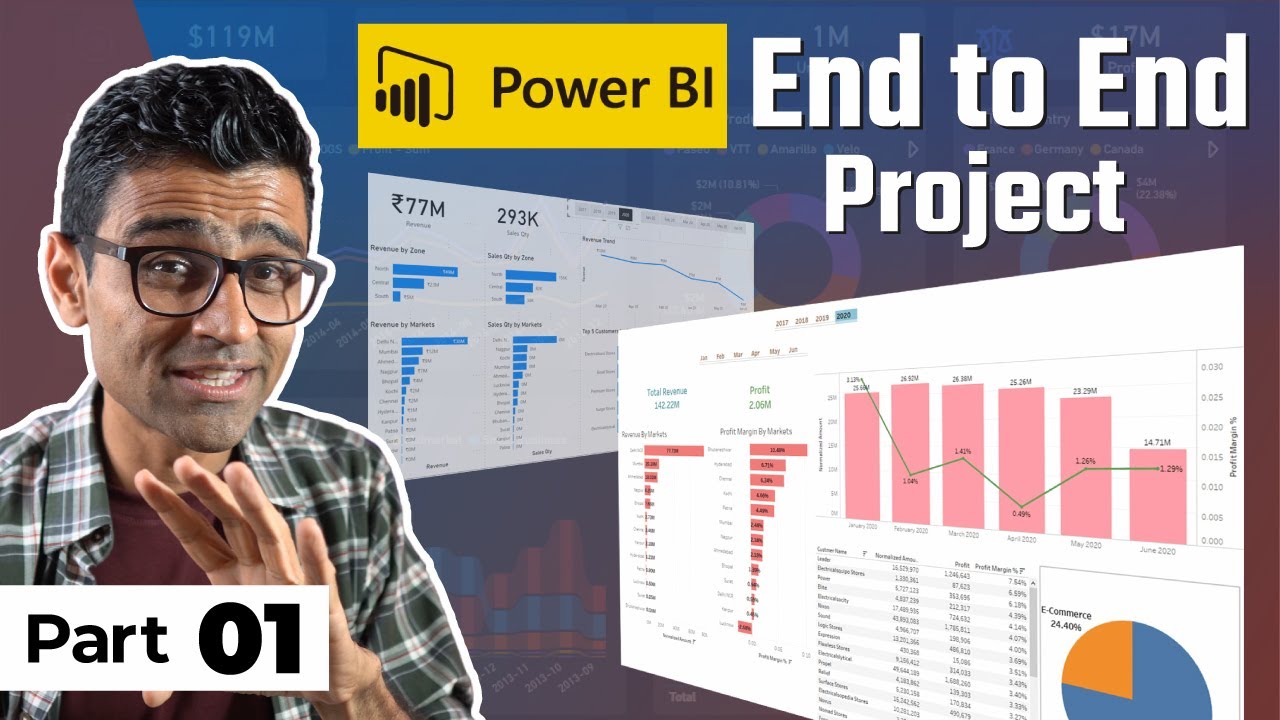
End to End Project Analysis | Business Insights 360 | Power BI | Excel | SQL | DAX
Summary
TLDRIn this detailed analysis, the presenter explains their work on the *Business Insight 360* project for Atli Hardware, a company specializing in keyboard accessories. The project aimed to help the company transition from intuition-based decision-making to data-driven strategies. By utilizing tools like Power BI, SQL, and Excel, they created interactive dashboards showcasing key insights on financials, sales, marketing, and supply chain performance. The project helped the company track KPIs, monitor product performance, and improve operational efficiency. The presenter highlights the importance of real-time data and how this analysis provided actionable insights to boost company performance in the competitive market.
Takeaways
- 😀 Atli Hardware is a manufacturing company that sells keyboard accessories through retailers, direct sales, and distributors.
- 😀 The company struggled with losses due to reliance on Excel and intuition-based decisions, prompting them to hire a data analysis team.
- 😀 The project aimed to provide data-driven insights to help the company make more informed decisions and improve future strategies.
- 😀 Key technical tools used in the analysis were SQL, Power BI Desktop, DAX, and Power Query for data modeling, cleaning, and visualizations.
- 😀 The finance view included year-over-year analysis of profit and loss, sales, margins, and performance metrics like net sales and gross margin.
- 😀 The sales view focused on customer and product performance, showing unit economics and identifying underperforming markets.
- 😀 In marketing, insights were provided on expenses and performance, with conditional formatting used to highlight areas not meeting targets.
- 😀 The supply chain view helped track inventory levels, forecast accuracy, and identified products at risk of being overstocked or out of stock.
- 😀 The executive view presented KPIs like revenue, market share, and channel performance, offering top-level insights for strategic decisions.
- 😀 The project helped generate real-time, live data dashboards, enabling ongoing updates and data-driven decision-making across the company.
Q & A
What is the core purpose of the project discussed in the video?
-The core purpose of the project was to provide data-driven insights for Atli Hardware, a company that sells keyboard accessories, to help them make better business decisions, particularly after their previous reliance on Excel analysis, surveys, and intuition led to significant losses.
What was the challenge faced by Atli Hardware before this project?
-Atli Hardware faced challenges because they were making decisions based on basic Excel analysis, surveys, and intuition, which resulted in huge losses. They lacked deep data insights, which led them to hire a team of data analysts to perform more comprehensive data analysis.
Which tools and technologies were used in the data analysis for this project?
-The major tools used in the analysis were SQL, Power BI Desktop, DAX, and Power Query. These technologies were crucial for data transformation, modeling, and visualizing insights.
What is the importance of data modeling in Power BI for this project?
-Data modeling in Power BI was critical as it helped organize and connect over 20 tables through one-to-many relationships. This allowed for more dynamic and efficient analysis, simplifying the creation of insights and reports.
What key performance indicators (KPIs) were tracked in the finance view?
-In the finance view, key performance indicators included net sales, gross margin, and net profit. These metrics were tracked year-over-year and compared to targets to assess performance.
How did the sales view help in analyzing the company's performance?
-The sales view provided insights into customer performance, product performance, and unit economics. It allowed the company to evaluate the sales performance across different regions and customer segments, as well as identify product performance relative to sales targets.
How did the marketing view help stakeholders understand their performance?
-The marketing view helped stakeholders understand the marketing expenses and performance by region and product segment. It included visual tools like a toggle button and conditional formatting to highlight underperforming areas, offering a more streamlined way to analyze marketing performance.
What was the role of the supply chain view in the analysis?
-The supply chain view provided insights into forecast accuracy, net error KPIs, and risk analysis. It helped identify potential stockouts or excessive manufacturing in different product segments, particularly for the Canadian market, which aided in inventory management.
What is the significance of the executive view created in Power BI?
-The executive view was particularly useful for top management, offering a consolidated overview of key metrics such as revenue by division and channel, market share trends, and performance relative to targets. This view helped stakeholders quickly assess the company's overall position and make strategic decisions.
What techniques did the analyst learn and apply during this project?
-The analyst learned several techniques, including using DAX for creating measures and calculated columns, transforming and cleaning data through Power Query, and managing large datasets. They also worked on data modeling, ETL processes, and using Power BI Services to publish live reports for real-time updates.
Outlines

This section is available to paid users only. Please upgrade to access this part.
Upgrade NowMindmap

This section is available to paid users only. Please upgrade to access this part.
Upgrade NowKeywords

This section is available to paid users only. Please upgrade to access this part.
Upgrade NowHighlights

This section is available to paid users only. Please upgrade to access this part.
Upgrade NowTranscripts

This section is available to paid users only. Please upgrade to access this part.
Upgrade NowBrowse More Related Video

Power BI Project For Beginners | Sales Insights Data Analysis Project - 1 - Problem Statement

The Dragons Fight Over Proper.com | Dragons' Den | Shark Tank Global

Interview HCM (matt jeff,surya,vicko,alfin)

Diagram Jaringan Kerja, Contoh Kasus.

Outsourcing Comercial: MHB Partners

WhatsApp Video 2024 11 11 at 12 33 20
5.0 / 5 (0 votes)