Analisis Statistik Deskriptif dengan SPSS beserta Interpretasinya
Summary
TLDRThis video script provides a step-by-step tutorial on preparing respondent data and conducting descriptive statistical analysis using SPSS. The presenter guides viewers on how to input variables, label them appropriately, and enter data into the software. They then demonstrate how to check data completeness, perform the analysis, and interpret the results, focusing on variables like price (X1), product quality (X2), and consumer loyalty (Y). The tutorial aims to give a general overview of the data, including mean values, maximum and minimum values, and standard deviation for each variable. The presenter also encourages viewers to like, subscribe, and share the video if they find it helpful.
Takeaways
- 😀 The video is a tutorial on preparing respondent data for statistical analysis in SPSS.
- 📊 The example given involves three variables: two independent variables (X1 and X2) and one dependent variable (Y).
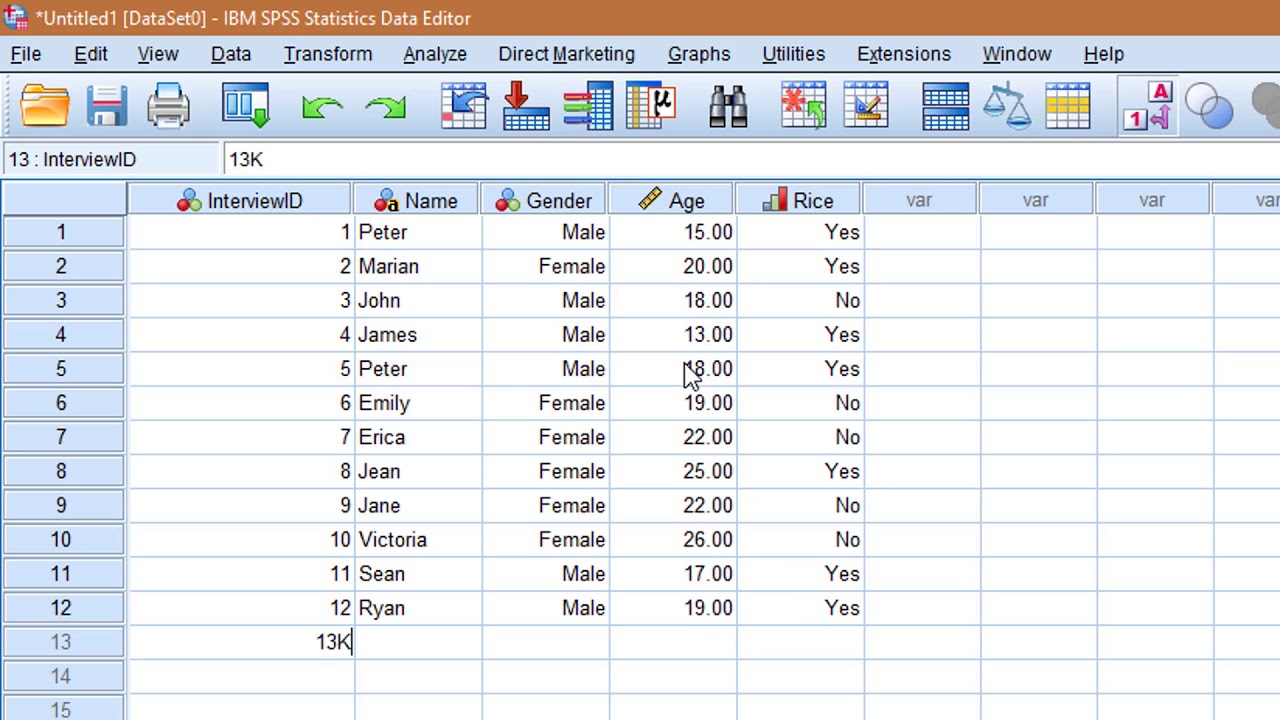
- 💻 Viewers are instructed to open SPSS and enter variable names such as 'X1', 'X2', and 'Y' in the Variable View.
- 🏷️ Labels for the variables are suggested to be descriptive, like 'harga' (price) for X1, 'kualitas produk' (product quality) for X2, and 'loyalitas konsumen' (consumer loyalty) for Y.
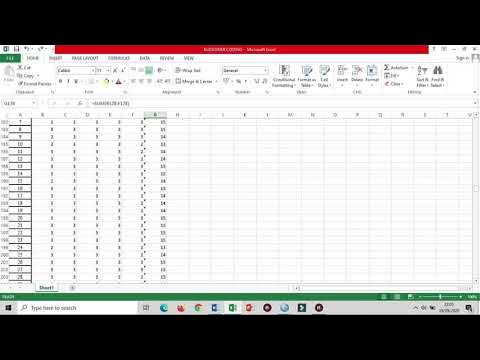
- 📋 The script demonstrates how to copy and paste data from a data view into SPSS for analysis.
- 🔍 The presenter checks for completeness of the data, mentioning that there should be 30 respondents in the example.
- 📊 The video covers how to perform a descriptive statistical analysis in SPSS, including selecting options like mean, standard deviation, maximum, and minimum.
- 📈 The results of the descriptive statistics are interpreted to provide a general overview of the data, such as average values and variability.
- 📝 The presenter copies the results from the output and uses them for interpretation, providing specific values for minimum, maximum, mean, and standard deviation.
- 👨🏫 The tutorial is aimed at helping viewers understand how to conduct and interpret a descriptive statistical analysis in SPSS.
- 👍 The video concludes with a reminder to like, subscribe, and share the content, indicating the end of the tutorial.
Q & A
What is the main purpose of the video?
-The main purpose of the video is to demonstrate how to input and analyze respondent data using SPSS, specifically focusing on descriptive statistics.
How many variables are used in the example provided in the video?
-Three variables are used in the example: two independent variables (X1 and X2) and one dependent variable (Y).
What are the labels given to the variables in the video example?
-The labels given are 'harga' for X1, 'kualitas produk' for X2, and 'loyalitas konsumen' for Y.
What is the first step in SPSS after opening the application according to the video?
-The first step is to go to the 'Variable View' in SPSS and input the variable names and labels.
How does the presenter suggest checking if the data is complete?
-The presenter suggests checking the completeness of the data by ensuring there are 30 respondents and verifying the data in the 'Data View'.
Which statistical test is demonstrated in the video?
-The video demonstrates the descriptive statistics test in SPSS.
What specific descriptive statistics are highlighted in the video?
-The video highlights mean, standard deviation, minimum, and maximum values for the variables.
What does the presenter do with the output from the descriptive statistics test?
-The presenter copies the output from the descriptive statistics test into a table for easier interpretation.
How is the interpretation of the descriptive statistics described?
-The interpretation is described by discussing the minimum, maximum, mean, and standard deviation values for each variable.
What advice does the presenter give regarding the interpretation of data?
-The presenter advises simplifying the interpretation and adjusting it as needed for clarity and completeness.
Outlines

This section is available to paid users only. Please upgrade to access this part.
Upgrade NowMindmap

This section is available to paid users only. Please upgrade to access this part.
Upgrade NowKeywords

This section is available to paid users only. Please upgrade to access this part.
Upgrade NowHighlights

This section is available to paid users only. Please upgrade to access this part.
Upgrade NowTranscripts

This section is available to paid users only. Please upgrade to access this part.
Upgrade NowBrowse More Related Video

Cara Membuat Tabulasi Data Kuesioner di Excel dan SPSS (Contoh Kuesioner Google Form)
cara mencari mean, median dan mode dari awal kuesioner, tabulasi dan menggunakan spss sampai hasil
Learn SPSS in 15 minutes

ANALISIS STATISTIK DESKRIPTIF (FREKUENSI DAN DESKRIPTIF) DENGAN SPSS

Analisis Data Penelitian Kuantitatif
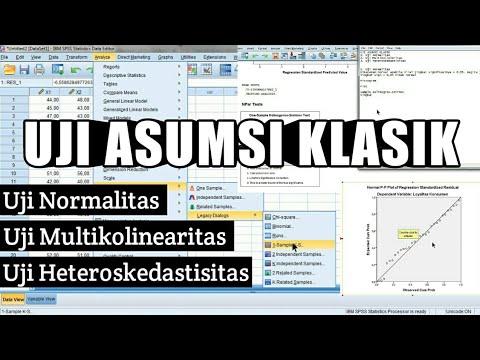
Tutorial SPSS Uji Asumsi Klasik : Uji Normalitas, Uji Multikolinearitas dan Uji Heteroskedastisitas
5.0 / 5 (0 votes)