VIDEO PEMBELAJARAN DARING STATISTIKA MODEL PROBLEM BASED LEARNING PPG DALJAB UNNES 2020
Summary
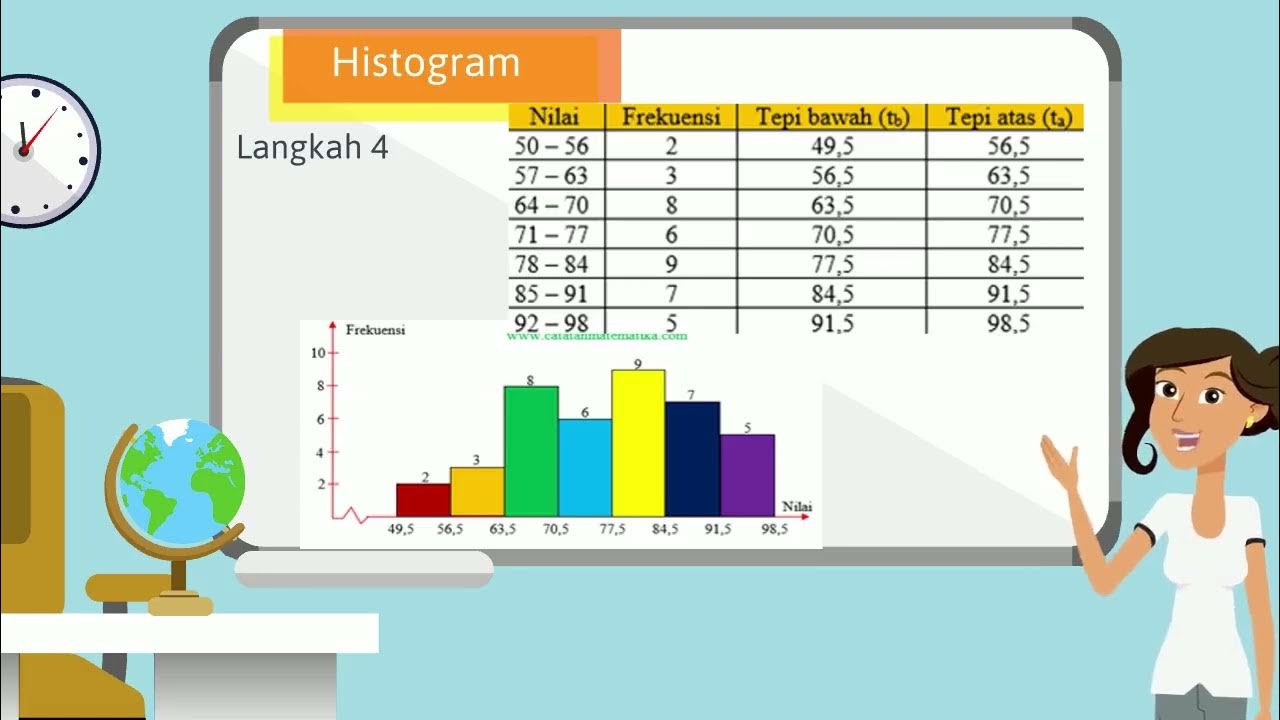
TLDRIn this session, the instructor guides students through a lesson on statistical data presentation, focusing on creating frequency distribution tables. After an opening prayer, students are divided into groups and tasked with analyzing contextual data. The instructor outlines a five-step process for constructing these tables, emphasizing the importance of accuracy and attention to detail. Groups discuss their challenges, fostering collaborative learning. The session concludes with a reflection on the learning objectives, and students are encouraged to apply their skills in real-life scenarios.
Takeaways
- 😀 The session began with a greeting and an introduction to the day's topic: statistics.
- 😀 Students were instructed to form groups similar to the previous session.
- 😀 The objective was to learn how to create frequency distribution tables from real-world data.
- 😀 Students were encouraged to read the provided guidelines and discuss tasks seriously.
- 😀 The time allocated for the task was 40 minutes, followed by a web meeting for presentations.
- 😀 The presentation by Group 1 was commended for its clarity and structure.
- 😀 Five steps for creating frequency distribution tables were outlined, starting with sorting the data.
- 😀 The range of the data is calculated by subtracting the smallest value from the largest value.
- 😀 Attention to detail is crucial in creating accurate frequency tables to avoid missing data.
- 😀 The session concluded with a reminder to reflect on the learning objectives and an invitation to pray together.
Q & A
What is the main topic of the learning session discussed in the transcript?
-The main topic of the session is statistics, specifically focusing on creating frequency distribution tables from contextual problems.
How were the groups formed for the task?
-The groups were formed similarly to the previous session, suggesting consistency in group dynamics.
What is the purpose of the assigned task?
-The purpose is for students to determine steps to present data in a frequency distribution table based on everyday contextual issues.
What is the duration given for completing the task?
-Students were given 40 minutes to complete the task.
What are the five steps mentioned for creating a frequency distribution table?
-1. Organize the data. 2. Find the range (max value - min value). 3. Decide the number of classes. 4. Determine the class width. 5. Create the frequency distribution table.
What did the teacher emphasize about the accuracy of data handling?
-The teacher emphasized the importance of being meticulous while handling data, as missing even one data point can lead to inaccuracies.
What was the feedback on the presentations given by the first group?
-The first group's presentation was well-received, noted for being well-organized and following the correct steps.
What kind of questions were posed to the students about their difficulties?
-Students were asked to share any difficulties they encountered while completing the assignment, particularly focusing on issues of attention to detail.
What is the ultimate goal of the learning objectives discussed in the session?
-The ultimate goal is for students to effectively create a frequency distribution table based on real-life problems, enhancing their statistical understanding.
How did the session conclude?
-The session concluded with a prayer led by a student, reinforcing a respectful closure to the learning experience.
Outlines

This section is available to paid users only. Please upgrade to access this part.
Upgrade NowMindmap

This section is available to paid users only. Please upgrade to access this part.
Upgrade NowKeywords

This section is available to paid users only. Please upgrade to access this part.
Upgrade NowHighlights

This section is available to paid users only. Please upgrade to access this part.
Upgrade NowTranscripts

This section is available to paid users only. Please upgrade to access this part.
Upgrade NowBrowse More Related Video

Statistika (Distribusi Frekuensi Data Tunggal dan Kelompok)

Statistika - Membaca dan Menyajikan data, Poligon Histogram Ogive

Statistika part #1~ PJJ Matematika Kelas XII #diagrambatang #diagramlingkaran #diagramgaris

VIDEO ANIMASI MATEMATIKA MATERI PENYAJIAN DATA KELAS 10

Statistika - Penyajian Data ( Histogram, Poligon & Ogive )

Statistika - Penyajian Data Eps.2 l Ruang Belajar #StudyWithDiida
5.0 / 5 (0 votes)