Candle Range Theory | CRT | The NEW Silver Bullet For Struggling Traders

PJ Trades
21 Apr 202411:29

Summary

TLDRThis video script delves into the concept of candle range theory in trading, emphasizing the importance of understanding each candle's range, from one-minute to four-hour intervals. It highlights three key aspects of an A+ range: inside candles, price action resting above or below, and specific time-based ranges. The script uses examples to illustrate how to identify market liquidity, opening prices, and the narrative behind each algorithmically printed candle. It encourages viewers to apply these insights to their own trading charts for a more strategic approach.

Takeaways

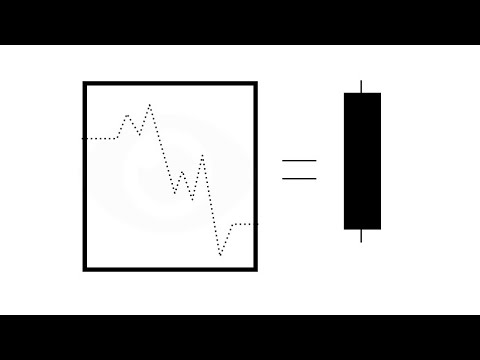
  • 📊 Candle Range Theory is about understanding the range of each candlestick chart, including the highs and lows within specific time frames.
  • 🔍 Key aspects of an A+ range include inside candles, price action (PDA) resting above or below, and the specific time frame of the range.
  • ⏱ Time frames can vary, such as Asia range, daily range, or 4-hour range, and are crucial for identifying liquidity and market movements.
  • 📈 Each candlestick represents a range with an opening price, high, low, and closing price, indicating the market's sentiment during that period.
  • 💡 Candlesticks are not random; they are algorithmically printed with a narrative, suggesting that patterns can be analyzed and understood.
  • 🔑 Inside bars are significant as they indicate accumulation and potential market reversals or continuations.
  • 📉 An order block can be created by identifying the range low and high, which can be used for entry and exit points in trading.
  • 🚀 Observing the opening, low, high, and closing prices of candles can provide insights into potential market direction and bias.
  • 📌 Each candlestick has a 'power of three', which may refer to the importance of the opening, high, low, and closing prices in analysis.
  • 📉 The concept of 'time-based premium and discount' is introduced, suggesting that the value of a candlestick can change based on its position within its time frame.
  • 📚 The presenter encourages viewers to apply these concepts to their own charts for a deeper understanding and practical application.

Q & A

  • What is the core concept of candle range theory?

    -The core concept of candle range theory is that each candle, regardless of its time frame (1 hour, 4 hours, etc.), represents a range with a high and a low, and it's essential to understand where liquidity is resting and the opening price.

  • What are the three key aspects of an A+ range according to the script?

    -The three key aspects of an A+ range are: inside candles specifically in a higher time frame, PDA (Price Discovery Area) resting above or below, and the specific time the range is occurring (e.g., Asia range, daily range, or 4-hour range).

  • What does 'PDA resting above or below' refer to in the context of candle range theory?

    -In the context of candle range theory, 'PDA resting above or below' refers to the Price Discovery Area being positioned either above or below the range, indicating where the market is finding value and potential support or resistance levels.

  • How does the speaker describe the formation of each candle in the market?

    -The speaker describes each candle as being algorithmically printed with a narrative behind it, implying that there is no randomness in the formation of candles and that each one carries specific information about market sentiment and activity.

  • What does the term 'inside bar' signify in the context of the script?

    -In the context of the script, an 'inside bar' signifies a candle that is completely contained within the previous candle's range, which can indicate accumulation or a period of consolidation in the market.

  • What is the significance of understanding the 'opening price' in relation to candle range theory?

    -Understanding the 'opening price' is significant because it helps in identifying potential entry and exit points for trades. It's used to determine if a market is opening at a premium or discount and can influence trading strategies.

  • What is the concept of 'sweeping the range low or high' mentioned in the script?

    -The concept of 'sweeping the range low or high' refers to the market price moving past the previous low or high of a candle's range, which can indicate a potential shift in market sentiment and may present trading opportunities.

  • How does the speaker suggest using the daily candle range in trading?

    -The speaker suggests using the daily candle range to identify key support and resistance levels, and to look for patterns such as inside bars or accumulation areas that could indicate potential market movements.

  • What is the importance of recognizing 'fair value gaps' in candle range theory?

    -Recognizing 'fair value gaps' is important as they can indicate significant shifts in market sentiment or the presence of large orders. These gaps can provide insight into potential market direction and areas of interest for traders.

  • How does the speaker define the 'power of three' in the context of each candle?

    -The 'power of three' in the context of each candle is not explicitly defined in the script, but it could refer to the three key elements that give each candle its significance: the opening price, the high, and the low.

  • What is the role of 'narrative' in the formation of each candle according to the speaker?

    -According to the speaker, the 'narrative' behind each candle refers to the underlying reasons and market conditions that lead to its formation. It suggests that each candle's creation is not random but is a result of specific market dynamics.

Outlines

00:00

📈 Introduction to Candle Range Theory

The speaker introduces the concept of candle range theory, emphasizing its simplicity at its core. They explain that each candlestick, regardless of its time frame (1 hour, 4 hours, etc.), represents a range with high and low points. The theory also involves identifying where liquidity is resting and the opening price. Three key aspects of an 'A+ range' are highlighted: inside candles on a higher time frame, price action (PDA) resting above or below, and specific time-based ranges such as daily or Monday ranges. The speaker also discusses the importance of recognizing the power and narrative behind each candlestick, which are algorithmically printed and not by chance. Examples are given to illustrate single candles as ranges and how higher time frames can become lower time frame ranges, using the daily candle on the Euro as an example.

05:02

📉 Analyzing Market Structure and Entry Points

This paragraph delves into analyzing market structure using candle range theory, focusing on identifying entry and exit points. The speaker describes how to use the opening low and high of the 4-hour candle to create an order block and discusses the significance of sweeping the range high and low. They mention the importance of recognizing support and resistance levels, fair value gaps, and market structure shifts. The speaker provides an example of how to catch the open, low, high, and close of a candle, and how to use these to form a bias for future trades. They also touch on the concept of time-based discounts and premiums associated with each candlestick, urging viewers to apply these concepts to their own chart analysis.

10:06

📊 Key Aspects of Candle Range Theory and Practical Application

The speaker wraps up the discussion by summarizing the three key aspects of candle range theory: identifying inside candles, recognizing price action resting above or below, and understanding specific time ranges. They stress the importance of considering each candle's range, open low/high, and close high/low. The speaker also highlights that each candle has its own time-based premium and discount, and each is algorithmically printed with a narrative. They encourage viewers to study and apply these concepts to their trading, hoping that the information provided will be beneficial and enhance their understanding of market dynamics.

Mindmap

Keywords

💡Candle Range Theory

Candle Range Theory is a method used in technical analysis of financial markets, focusing on the range of price movements within a specific time frame represented by each candlestick. In the video, it is the central theme, with the speaker discussing how each candle, whether it's a 1-hour, 4-hour, or daily candle, has a range high and range low, which are critical for understanding market dynamics.

💡Liquidity

Liquidity in the context of financial markets refers to the ease with which assets can be bought or sold without affecting their price. In the video, the speaker emphasizes the importance of identifying where liquidity is resting, which is crucial for understanding the support and resistance levels within the candle range theory.

💡Opening Price

The opening price is the price at which trading begins for a given asset at the start of a trading session. The script mentions the significance of the opening price in relation to the range high and range low, indicating how it can be used to predict market movements and identify entry and exit points in trading.

💡Inside Candle

An inside candle is a candlestick pattern where the entire body of the current candle is contained within the body of the previous candle. In the video, the speaker uses inside candles as an example to illustrate how higher time frame patterns can influence lower time frame ranges, indicating potential market reversals or continuations.

💡PDAs (Price Action)

Price Action (PDAs) refers to the movement of an asset's price over time, which traders analyze to make trading decisions. The speaker in the video discusses how PDAs resting above or below certain levels can indicate market sentiment and potential trading opportunities within the candle range theory.

💡Time Frame

Time frame in trading refers to the duration over which a particular price action is observed, such as 1-hour, 4-hour, or daily. The video script explains how different time frames can have different ranges and how understanding these can help in making trading decisions based on candle range theory.

💡Range High and Range Low

Range High and Range Low are the highest and lowest prices reached by a security within a specific time frame. The script uses these terms to explain how to identify the boundaries of price movements within each candle, which is fundamental to candle range theory and making informed trading decisions.

💡Order Block

An order block is a level at which a significant number of buy or sell orders are placed, often acting as a psychological barrier for price movement. The speaker in the video describes how order blocks can be identified and used in conjunction with candle range theory to predict potential market reactions.

💡Fair Value Gap

A fair value gap is a price level that traders perceive as a reasonable or fair price for an asset. In the script, the speaker mentions fair value gaps in the context of identifying market structure shifts and potential re-entry points for trades based on candle range theory.

💡Bias

Bias in trading refers to the overall direction or trend that the market is expected to take. The video script discusses how forming a bias can help traders understand the market's direction after certain price actions, such as breaking through range highs or lows within the candle range theory.

💡Algorithmic Printing

Algorithmic printing refers to the process by which trading algorithms generate the price data that forms the candlesticks on a chart. The speaker emphasizes that each candle is not random but is algorithmically printed with a narrative, suggesting that understanding these narratives can provide insights into market behavior.

Highlights

Introduction to candle range theory for a simple understanding of market movements.

Each candlestick, regardless of time frame, represents a range with high and low points.

Key aspects of A+ range include inside candles, liquidity resting points, and specific time frames.

Understanding the opening price and where liquidity rests is crucial for trading decisions.

Candlestick analysis involves recognizing patterns like inside bars and accumulation areas.

Market movements are not by chance; each candlestick is algorithmically printed with a narrative.

Examples of single candles being a range and higher time frame becoming a lower time frame range.

Analyzing daily candles for inside bars and accumulation to predict market movements.

Importance of observing the order block and resistance levels within candle ranges.

Using the range low and high to make informed trading decisions.

The concept of time-based premium and discount in relation to candlestick analysis.

Identifying market bias and potential re-entry points after analyzing candlestick patterns.

The significance of the opening, low, high, and closing prices within each candlestick.

Applying candle range theory to 4-hour candles for trading strategies.

Recognizing market structure shifts and using them to inform trading decisions.

The importance of each candlestick having a power of three and its own time-based premium and discount.

Encouragement to study and apply candle range theory to personal trading charts.

Transcripts

play00:00

[Music]

play00:10

how's everybody

play00:11

doing back

play00:13

again going over candle range Theory

play00:16

today right just my pretty much simple

play00:20

understanding of it all right I have

play00:22

more than a simple understanding but

play00:24

it's pretty simple to understand right

play00:26

at the core of

play00:28

it each

play00:30

candle and I mean each candle 1 Hour 4

play00:34

Hour the one minutes within the 4 Hour

play00:37

right every candle is a range right we

play00:41

we go range high range low range Low

play00:43

Range

play00:45

High

play00:47

right with candle range

play00:51

Theory we also want to have the key

play00:55

noted or the key notes of where is

play00:58

liquidity resting

play01:01

when and where is our opening

play01:05

price all right there's three key

play01:08

aspects to an A plus

play01:11

range right we have inside

play01:14

candles specifically higher time frame

play01:17

inside

play01:18

candles we have pdas resting above or

play01:22

below as well as are these ranges at

play01:25

specific time

play01:26

based excuse me are these ranges at

play01:29

specific specific

play01:31

times right whether an Asia range

play01:35

or right a daily range or just a

play01:38

4our right Monday range where we

play01:41

accumulated the whole

play01:44

Monday all

play01:46

right as well as your just your simple

play01:48

4H hour candle range your 1 hour candle

play01:51

range your daily candle range right

play01:55

every candle has a range right a premium

play01:58

and a discount an open low high close

play02:00

and an open high low close right each

play02:04

candle has its own power of

play02:06

three right as well as

play02:11

AMD and what you should always know is

play02:13

each candle is printed alri Al Jesus

play02:19

Christ there's no

play02:22

winning each candle is printed

play02:24

algorithmically and with a narrative

play02:26

behind

play02:28

it right nothing is by luck nothing's by

play02:31

chance all of these

play02:34

candles are algorithmically printed and

play02:38

have everything listed below right we're

play02:41

going to get into a couple examples of

play02:44

right single candles being a range as

play02:46

well as that higher time frame becoming

play02:49

a lower time frame

play02:51

range all right so we

play02:54

see in our face we have a daily candle

play02:58

on Euro

play03:00

given us an inside

play03:03

bar

play03:06

right clear

play03:08

accumulation we have a high of our

play03:10

accumulation and a

play03:12

low come into a lower time frame see we

play03:16

start to break leave a fair value

play03:20

Gap mitigate

play03:23

it right and Wick above the Range

play03:27

High we then come back to our order

play03:29

block rejection block right then

play03:33

continue to break

play03:35

lower right we have low resistance

play03:39

liquidity as well as the bottom of our

play03:42

range we see within this daily candle

play03:45

right we sop the the daily

play03:48

high right and continued to the

play03:51

low all right here we have right in

play03:55

front of us another right inside bar on

play03:59

the 4 time frame with two equal lows

play04:03

below so what would you want to see here

play04:06

all right would you yourself want to see

play04:09

the next 4H hour candle all right open

play04:13

high

play04:15

low close right R open low high

play04:23

close all right and you don't I mean you

play04:27

don't even have to predict it per se

play04:29

right you can just look for one or the

play04:32

other

play04:34

right we have an order block resting

play04:37

below FEG resting

play04:39

above we have our

play04:43

range still in a range right sweep the

play04:47

range

play04:51

low so we now have our

play04:57

open low

play05:01

right of the daily candle we

play05:04

opened

play05:07

Low by below the opening price of the

play05:10

4our candle sweep

play05:15

right create an order

play05:24

block

play05:26

right so how we swept range low now we

play05:29

swep Range High and you're going to say

play05:30

oh should we continue

play05:36

lower right but I would say

play05:39

no right you have low resistance resting

play05:43

above right obvious fair value Gap

play05:46

obvious fair value

play05:50

Gap swept the equal

play05:53

lows fake Market structure

play05:58

shift didn't get a nice sweep of our

play06:00

range low for another

play06:04

re-entry but we see right we did on the

play06:08

daily open open low high close

play06:31

I was just going to say right there I

play06:32

clicked one two ahead right see we

play06:35

haven't break broken any external High

play06:40

Right started to accumulate Swip the

play06:42

accumulation low right higher breaker

play06:46

come back into the order

play06:48

block right the day closes we open low

play06:54

sweep the low here high and then close

play06:58

right higher on the day

play07:01

and that's just you know simply used in

play07:03

the 4-Hour candles right sweeping either

play07:06

previous day low or internal to external

play07:09

right we saw Here We swept the range low

play07:12

and the previous day low and then

play07:15

continued us higher into our FEG and we

play07:18

do have a market maker model

play07:20

here right but we also have an

play07:25

feeg and we could retrace lower right

play07:28

back to our break then continue higher

play07:31

right and then we can form a bias from

play07:33

there right but we saw how we caught the

play07:35

open

play07:38

low high

play07:41

close all right and if you're still a

play07:43

little bit confused that's all right

play07:46

right we want to keep keep in mind right

play07:49

our three key

play07:51

aspects inside

play07:53

candle right PDA is resting

play07:59

right as well

play08:06

as which specific time candle is

play08:10

it all right each candle has our open

play08:15

low high close right our open high low

play08:20

close

play08:22

right and as well with each

play08:25

candle right we draw a Candlestick here

play08:40

right we draw our

play08:42

Candlestick we have our opening price of

play08:45

the 4our candle here say this is a

play08:50

4our

play08:54

right if you're looking for a

play08:56

open low high

play09:00

close you want to buy below the opening

play09:04

price and a

play09:06

discount

play09:11

right right and a Time based discount

play09:14

right because each

play09:16

candle right has a premium and

play09:19

discount

play09:21

right zoom out just a little bit

play09:26

more right each specific candle has its

play09:30

own right you have your

play09:32

EQ right same way with we use the the

play09:36

daily

play09:40

candle you have your

play09:43

high your

play09:46

low you're

play09:47

open and you're

play09:49

close all right that leaves you with an

play09:53

EQ of the

play09:55

candle

play09:56

right as well as if you open you have

play10:00

your timebase discount right leading in

play10:06

to your time base

play10:08

premium

play10:09

right after you open low then High close

play10:14

all

play10:19

right all right and on your own

play10:22

charts I want you to kind of use your

play10:24

head and see how of each candle right we

play10:26

go to the range low of the candle and

play10:29

Range High range Low Range High internal

play10:31

external internal external internal

play10:33

external right we saw where liquidity

play10:35

was resting and where was our opening

play10:37

price right whether it be a previous day

play10:40

liquidity right previous session right

play10:44

yada yada yada we went over the three

play10:46

key aspects to our A+ range with an

play10:48

inside candle PD resting above or below

play10:51

and our specific time

play10:53

range right we want to always keep in

play10:55

mind each candle has a range each candle

play10:59

has an open low high close open high low

play11:01

close all right if that's I think I yeah

play11:04

um each candle has a power of three each

play11:06

candle has its own time based premium

play11:08

and discount each candle has its own

play11:11

AMD and each candle is printed aloric

play11:15

and with a narrative based behind it

play11:19

hope you learned something from this

play11:20

episode hope you enjoy and right hope

play11:23

you can you know study and input this

play11:25

into your own charts y'all have a good

play11:27

one stay safe

Rate This

5.0 / 5 (0 votes)

Related Tags
Candle RangeTrading TheoryLiquidityOpening PriceTime FrameMarket AnalysisTechnical AnalysisTrading StrategyFinancial MarketsInvestment Education