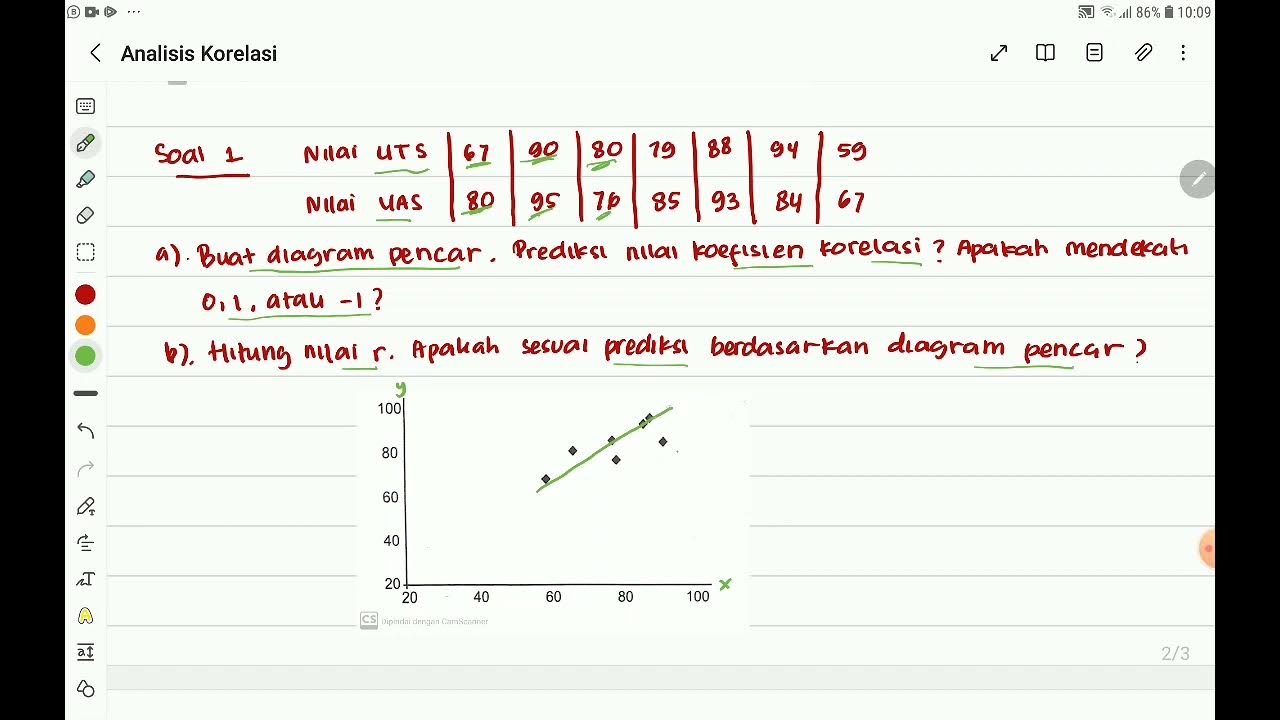
Belajar Statistika - Fase F - Analisis Data Bivariat (bagian 1) - Korelasi #merdekabelajar
Summary
TLDRThis educational video covers the topic of bivariate data analysis, focusing on correlation and regression. It explains the distinction between univariate, bivariate, and multivariate data, emphasizing how to analyze the relationship between two variables. The lesson includes a step-by-step guide to calculating the correlation coefficient, demonstrating the process using a practical example. The video also highlights the importance of distinguishing between correlation and causation, and encourages students to practice applying the methods to real-world datasets, such as the relationship between car age and emission levels in Wakanda.
Takeaways
- 😀 Data analysis in statistics is divided into univariate, bivariate, and multivariate types based on the number of variables.
- 😀 Bivariate data consists of two related variables, such as height and shoe size or temperature and ice cream sales.
- 😀 Bivariate analysis aims to understand the relationship between two variables, using methods like correlation and regression.
- 😀 Correlation analysis helps determine the strength and direction of the relationship between two variables.
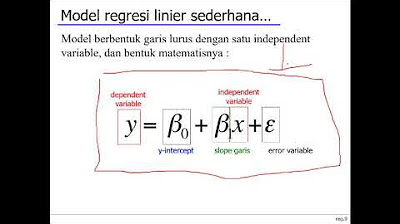
- 😀 Regression analysis involves creating a statistical model, often a mathematical equation, to predict the dependent variable based on the independent variable.
- 😀 The formula for correlation is used to measure the strength of the relationship between two variables, with 'r' representing the correlation coefficient.
- 😀 A high correlation coefficient (close to 1 or -1) indicates a strong relationship between variables, while a low value (near 0) suggests weak or no relationship.
- 😀 Correlation does not imply causation; two variables may be related without one necessarily causing the other.
- 😀 For regression analysis, after calculating the correlation coefficient (r), a significance test (like t-test or f-test) is needed to assess the validity of the relationship.
- 😀 A practical example involves testing the relationship between vehicle age and emission levels, where bivariate data analysis can determine if there's a meaningful connection.
Q & A
What is the main focus of the lesson in the transcript?
-The main focus of the lesson is bivariate data analysis, specifically correlation and regression analysis, as part of the F phase in the Merdeka curriculum.
What is the difference between univariate, bivariate, and multivariate data?
-Univariate data involves one variable (e.g., height, weight), bivariate data involves two variables (e.g., height and shoe size), and multivariate data involves more than two variables.
What is bivariate data analysis, and what are its two main types?
-Bivariate data analysis is used to study the relationship between two variables. The two main types are correlation analysis, which measures the strength of the relationship, and regression analysis, which creates a mathematical model to predict one variable based on another.
What does correlation analysis aim to achieve?
-Correlation analysis aims to determine whether a relationship exists between two variables and to measure the strength and direction of that relationship.
What does the Pearson correlation coefficient (r) represent?
-The Pearson correlation coefficient (r) represents the strength and direction of the linear relationship between two variables. It ranges from -1 (perfect negative correlation) to +1 (perfect positive correlation), with 0 indicating no linear relationship.
What is the significance of the correlation coefficient (r), and how is it tested?
-The correlation coefficient (r) indicates the strength and direction of a relationship between two variables. To test its significance, statistical tests such as the t-test or F-test are used after calculating the coefficient.
Why is it important to note that correlation does not imply causation?
-It is important because correlation only indicates a relationship between two variables but does not prove that one variable causes the other. Other factors could influence both variables simultaneously.
What is the process of calculating the correlation coefficient (r)?
-The process involves preparing the data, calculating the means of both variables, finding the deviations from the mean for each data point, squaring the deviations, and then calculating the correlation coefficient using the formula.
In the example given, what relationship is being tested in the vehicle emissions study?
-In the vehicle emissions study, the relationship between the age of the car and the level of hydrocarbons in the emissions is being tested.
What role does regression analysis play in bivariate data analysis?
-Regression analysis is used to create a statistical model, typically in the form of a mathematical equation, to predict the value of the dependent variable (Y) based on the independent variable (X).
Outlines

This section is available to paid users only. Please upgrade to access this part.
Upgrade NowMindmap

This section is available to paid users only. Please upgrade to access this part.
Upgrade NowKeywords

This section is available to paid users only. Please upgrade to access this part.
Upgrade NowHighlights

This section is available to paid users only. Please upgrade to access this part.
Upgrade NowTranscripts

This section is available to paid users only. Please upgrade to access this part.
Upgrade NowBrowse More Related Video

Analisis Korelasi "Nilai Koefisien Korelasi dan Tingkat Korelasi" Part 1 Mtk 11 SMA Kmerdeka

Cara Menghitung Analisis Regresi Sederhana secara Manual

Week 6 Statistika Industri II - Analisis Regresi (part 1)

Statistika Bivariat: Mengungkap Hubungan Dua Variabel!

Statistik Teori pertemuan ke ~ 9 Korelasi dan Regresi

Statistika: Uji Korelasi-Regresi sederhana menggunakan SPSS
5.0 / 5 (0 votes)