Histogram en frequentiepolygoon (HAVO wiskunde A & VWO wiskunde A/C)
Summary
TLDRThis tutorial explains how to create histograms and frequency polygons (frequentiepolygoon) using a given dataset. The presenter breaks down the process step-by-step, demonstrating how to draw these visualizations based on the number of siblings students have. Key points include the correct way to plot axes, the importance of leaving the first and last bars empty in histograms, and how to use line diagrams for frequency polygons. The video also emphasizes the need to add titles to the axes and charts to avoid losing marks. Perfect for those learning to graph data effectively.
Takeaways
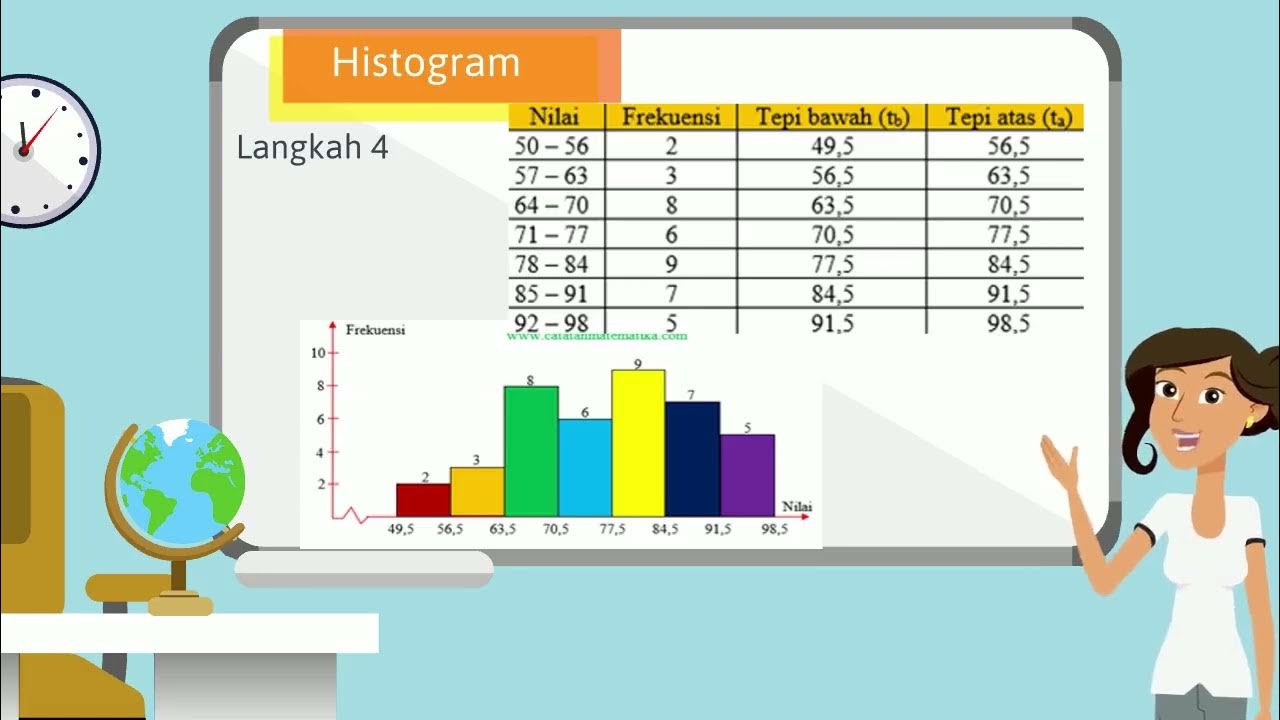
- 😀 A histogram is a bar chart that visually represents the frequency of data within certain intervals or categories.
- 😀 For a histogram, the horizontal axis (x-axis) represents categories (e.g., the number of siblings), while the vertical axis (y-axis) represents the frequency of each category.
- 😀 When creating a histogram, leave the first and last categories on the horizontal axis empty, and place the category labels in the center of each box.
- 😀 It’s important to title the horizontal axis as 'Aantal' (Number) and the vertical axis as 'Frequentie' (Frequency) in the histogram.
- 😀 To avoid losing points, always add a title for the entire histogram figure, such as 'Aantal Broers/Zussen' (Number of Siblings).
- 😀 In a histogram, draw bars with their tops corresponding to the frequency value, and ensure the bars align correctly with the axis labels.
- 😀 A frequency polygon is essentially a line graph that connects data points, rather than using bars like in a histogram.
- 😀 The frequency polygon starts and ends at the x-axis (ground level), meaning it should begin at zero and finish on the horizontal axis.
- 😀 When drawing a frequency polygon, place data points at the frequency values for each category, then connect these points with straight lines.
- 😀 Unlike in histograms, for frequency polygons, you place the category labels at the edges of the boxes on the horizontal axis, not in the center.
- 😀 Similar to the histogram, the frequency polygon also requires titles for the axes and the figure to ensure clarity and completeness.
Q & A
What is the primary focus of the video?
-The video focuses on teaching how to draw histograms and frequency polygons using a table of data, with an example based on the number of siblings each student has.
What is a histogram and how is it different from a bar chart?
-A histogram is a type of bar chart used to represent the frequency of data, but with the special condition that the first and last horizontal boxes must remain empty.
What is an important step when creating a histogram?
-An important step when creating a histogram is to leave the first and last horizontal boxes empty and place the data values in the center of the boxes.
How should the axes be labeled when drawing a histogram?
-The horizontal axis should be labeled 'Number of Siblings,' and the vertical axis should be labeled 'Frequency.' Additionally, the overall figure should be given the title 'Number of Siblings.'
What should you avoid when drawing the horizontal axis for a histogram?
-You should avoid placing the values directly at the edge of the boxes on the horizontal axis. Instead, place the values in the center of each box.
What is the difference between a histogram and a frequency polygon?
-A histogram is a bar chart that represents data in terms of frequencies, whereas a frequency polygon is a line graph that connects points representing the frequency of each category.
What is the key characteristic of a frequency polygon when it comes to the axes?
-A frequency polygon begins and ends on the horizontal axis, meaning that the first and last points must be placed at the ground level of the horizontal axis.
When drawing a frequency polygon, where should the data points be placed?
-For a frequency polygon, data points should be placed at the edges of the boxes on the horizontal axis, not in the center like in a histogram.
How should the points in a frequency polygon be connected?
-The points in a frequency polygon should be connected with straight lines, forming a continuous line graph.
What are some key things to remember when drawing both histograms and frequency polygons?
-Always leave the first and last horizontal boxes empty, label the axes correctly, provide titles for both axes and the overall figure, and ensure that all data points are plotted accurately.
Outlines

This section is available to paid users only. Please upgrade to access this part.
Upgrade NowMindmap

This section is available to paid users only. Please upgrade to access this part.
Upgrade NowKeywords

This section is available to paid users only. Please upgrade to access this part.
Upgrade NowHighlights

This section is available to paid users only. Please upgrade to access this part.
Upgrade NowTranscripts

This section is available to paid users only. Please upgrade to access this part.
Upgrade NowBrowse More Related Video
CARA PENYAJIAN DATA KELOMPOK - MATEMATIKA SMA
FREKUENSI RELATIF DAN FREKUENSI KUMULATIF, HISTOGRAM, DAN POLIGON

Representações Gráficas I | Estatística Básica 03

Evaluasi kajian Statistika dlm masalah Kontekstual (Yunita)
VIDEO ANIMASI MATEMATIKA MATERI PENYAJIAN DATA KELAS 10
Statistika - Membaca dan Menyajikan data, Poligon Histogram Ogive
5.0 / 5 (0 votes)