Uji T (T-Test) Konsep Dasar, Contoh Kasus dan Penerapan Menggunakan SPSS
Summary
TLDRThis lecture covers the essential concepts of the T-test, including its history, types, and applications in hypothesis testing. Introduced by WS Gosset in 1908, the T-test is used to analyze small sample sizes and is crucial for testing means. The types discussed include the one-sample, paired-sample, and independent-sample T-tests, each suited for specific research scenarios. The lecture also provides practical guidance on how to use SPSS for performing T-tests, with examples such as comparing productivities or sales before and after an intervention. The session ensures clarity on how to interpret results for valid conclusions.
Takeaways
- 😀 The T-test, first introduced by WS Gosset in 1908, is used to analyze differences between sample means. It is called the Student's T-distribution because Gosset used the pseudonym 'Student.'
- 😀 The T-test is used to test two main hypotheses: (1) testing the mean of a single sample, and (2) comparing the means of two samples to check for significant differences.
- 😀 The T-test requires interval or ratio scale data and assumes that the data follows a normal distribution. If the sample size is larger than 30, a Z-test is used instead.
- 😀 The T-test is suitable for small sample sizes, typically less than 30. The standard deviation of the population is assumed to be unknown in T-tests.
- 😀 There are three types of T-tests: One-sample T-test, paired sample T-test, and independent sample T-test.
- 😀 The One-sample T-test compares the mean of a sample with a specific constant value. For example, testing if the average weight of students in a class is 52 kg.
- 😀 The Paired T-test compares the means of two related groups, such as testing the impact of a pandemic on students' weight before and after the event.
- 😀 The Independent Sample T-test compares the means of two independent groups, like comparing the average weight of students in two different classes.
- 😀 The formula for the One-sample T-test involves calculating the sample mean, the constant value, and the sample standard deviation. The test compares the calculated T-value to a critical value from the T-distribution.
- 😀 SPSS can be used to perform T-tests, with steps such as entering data, checking for normality, and running the analysis to calculate T-values and p-values. The hypothesis is rejected if the T-value is greater than the critical value or if the p-value is smaller than the significance level.
- 😀 In practical examples, the T-test can be applied to test hypotheses like comparing productivity with a national average or evaluating the impact of policy changes, such as the effect of tax increases on motorcycle sales.
Q & A
What is the main purpose of the t-test?
-The t-test is used to compare the means of one or two groups to determine if there is a significant difference between them.
Who introduced the t-test, and why is it named 'Student's t-distribution'?
-The t-test was introduced by William Sealy Gosset in 1908. It is called 'Student's t-distribution' because Gosset used the pseudonym 'Student' when publishing his work.
When is a t-test appropriate to use?
-A t-test is appropriate when testing the mean of a small sample (less than 30), where the population standard deviation is unknown, and the data is assumed to be normally distributed.
What are the types of t-tests mentioned in the script?
-The script mentions three types of t-tests: one-sample t-test, paired t-test (dependent samples), and independent samples t-test.
What is the difference between a paired t-test and an independent t-test?
-A paired t-test is used when the two samples are related or matched (e.g., measurements taken before and after a treatment on the same subjects). An independent t-test is used when the samples are from different, unrelated groups.
What is the formula for the one-sample t-test?
-The formula for the one-sample t-test is t = (x̄ - μ) / (s / √n), where x̄ is the sample mean, μ is the population mean, s is the sample standard deviation, and n is the sample size.
What assumptions must be met for the t-test to be valid?
-The t-test assumes that the data is normally distributed, the sample size is small (less than 30), and the population standard deviation is unknown.
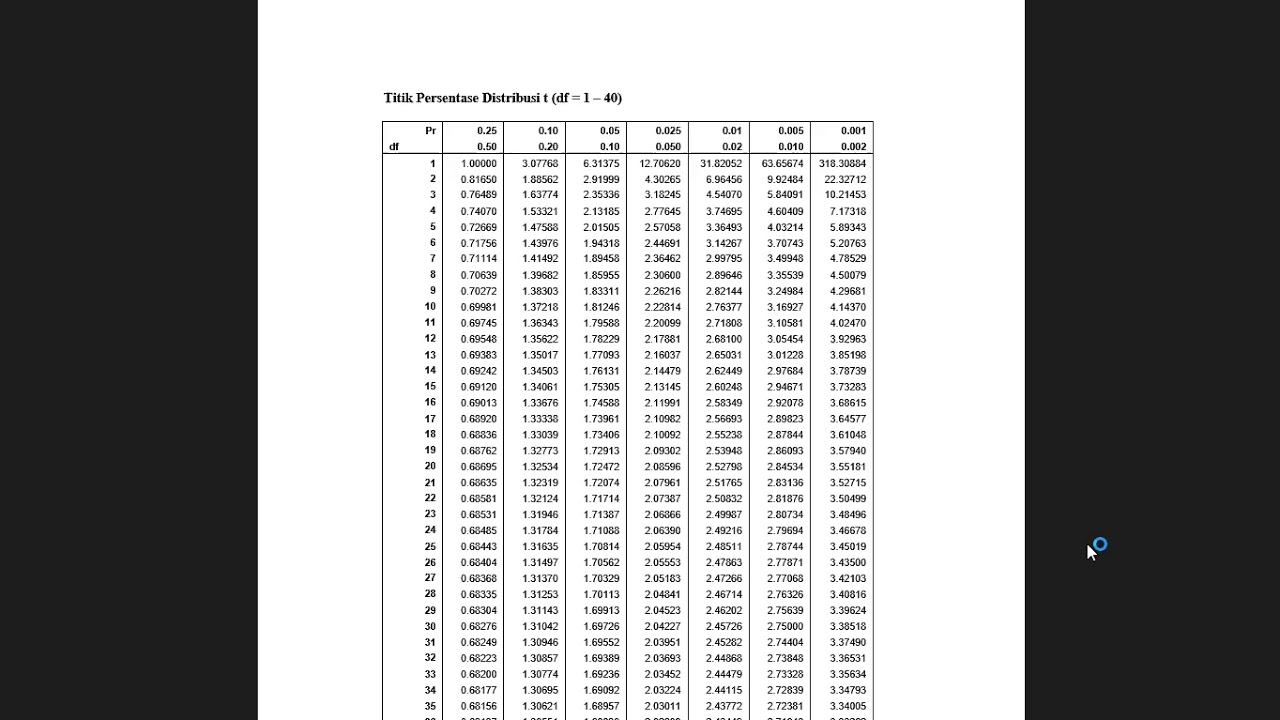
What is the critical value (t-table) used for in a t-test?
-The critical value from the t-table is used to determine whether the test statistic (t-value) is significant. If the absolute value of the t-statistic exceeds the critical t-value, the null hypothesis is rejected.
How do you interpret the p-value in a t-test?
-If the p-value is less than the significance level (α, typically 0.05), you reject the null hypothesis. A p-value greater than α means you fail to reject the null hypothesis.
How did the SPSS analysis help in determining the results of the t-tests?
-SPSS was used to perform the t-tests by inputting the data and conducting normality tests. It provided the t-statistic and p-value, which were compared to the critical values to draw conclusions about whether to accept or reject the null hypothesis.
Outlines

This section is available to paid users only. Please upgrade to access this part.
Upgrade NowMindmap

This section is available to paid users only. Please upgrade to access this part.
Upgrade NowKeywords

This section is available to paid users only. Please upgrade to access this part.
Upgrade NowHighlights

This section is available to paid users only. Please upgrade to access this part.
Upgrade NowTranscripts

This section is available to paid users only. Please upgrade to access this part.
Upgrade Now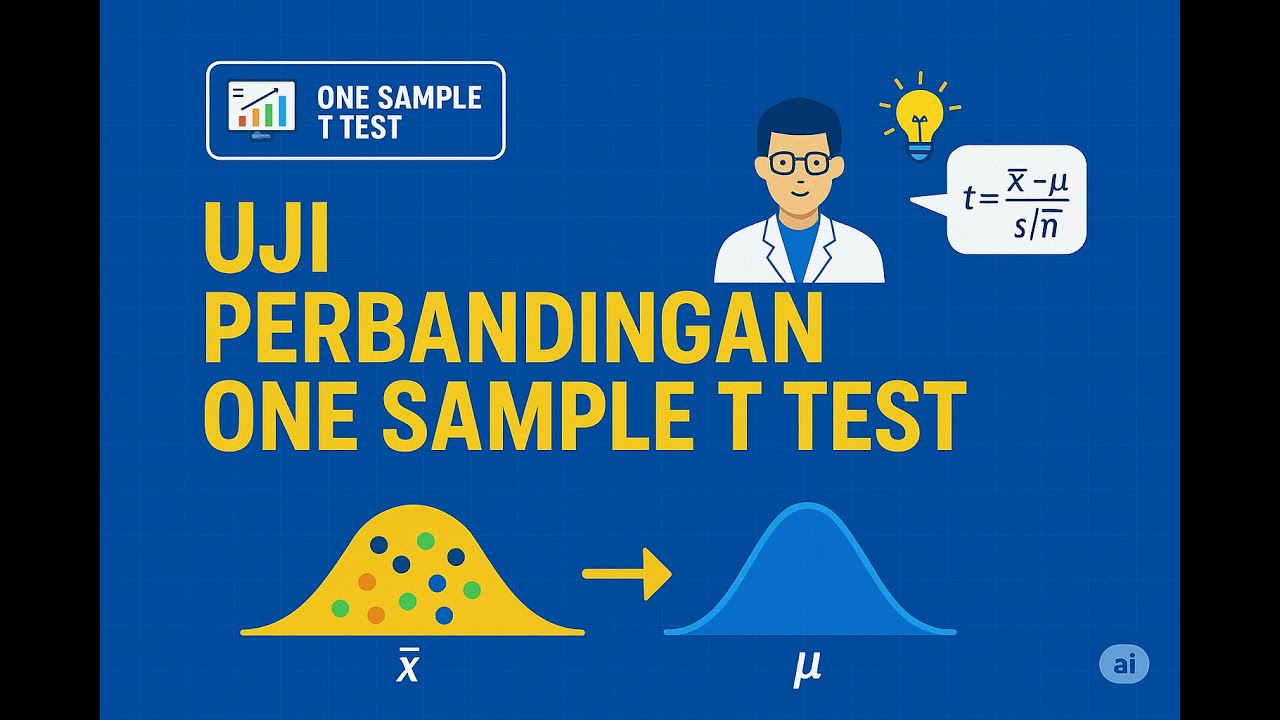


5.0 / 5 (0 votes)