What is Electrochemical Impedance Spectroscopy (EIS) and How Does it Work?
Summary
TLDRThis video introduces Electrochemical Impedance Spectroscopy (EIS), a complex technique used to study electrochemical systems. It explains the fundamentals of EIS, including its components, data generation, and usage. EIS involves applying a sinusoidal potential to an electrochemical system and measuring the resulting current. The data is analyzed through Fourier transforms to obtain impedance, which can be represented in Bode and Nyquist plots. The technique allows for probing different electrochemical phenomena occurring at various time scales, such as double layer charging and diffusion, providing both qualitative and quantitative insights into electrochemical systems.
Takeaways
- 😀 Electrochemical Impedance Spectroscopy (EIS) is a technique used to measure the impedance of electrochemical systems by applying a sinusoidal potential or current and measuring the corresponding current or potential.
- 😀 EIS can be performed in two modes: potentiostatic (applying sinusoidal potential and measuring current) and galvanostatic (applying sinusoidal current and measuring potential).
- 😀 The key attributes of the sinusoidal signals in EIS include amplitude, angular frequency (how often the signal oscillates), and phase shift (the offset between input and output signals).
- 😀 The frequency-dependent data generated in EIS is transformed using a Fourier transform, converting time-domain data to the frequency domain.
- 😀 The ratio of the frequency-dependent potential to current gives the impedance, analogous to Ohm's Law but using impedance (Z) instead of resistance (R) for AC systems.
- 😀 EIS is used to investigate different electrochemical phenomena that occur on various time scales, such as double-layer charging (microseconds) and diffusion (milliseconds), by probing characteristic frequencies.
- 😀 The data from an EIS experiment can be represented in several ways, including a Bode plot (magnitude and phase vs. frequency) and a Nyquist plot (real vs. imaginary impedance).
- 😀 The Nyquist plot breaks down impedance into real (Z_real) and imaginary (Z_imaginary) components, which can provide insights into different electrochemical processes within the system.
- 😀 EIS allows researchers to model complex electrochemical systems using well-known circuit elements like resistors (for solution resistance) and capacitors (for electrochemical double-layer behavior).
- 😀 By fitting the impedance data to an equivalent circuit model, both qualitative and quantitative information can be extracted, such as solution resistance, electrochemical double-layer capacitance, and charge transfer resistance.
- 😀 Despite its complexity, EIS is a powerful technique for understanding electrochemical systems, providing detailed insights into phenomena that occur simultaneously but on different time scales.
Q & A
What is Electrochemical Impedance Spectroscopy (EIS)?
-Electrochemical Impedance Spectroscopy (EIS) is a technique where a sinusoidal potential or current is applied to an electrochemical system, and the resulting sinusoidal current or potential is measured. This allows for the study of impedance, which can reveal detailed information about the electrochemical system.
What are the two types of EIS based on the signal applied?
-There are two main types of EIS: potentiostatic EIS, where a sinusoidal potential is applied and the current is measured, and galvanostatic EIS, where a sinusoidal current is applied and the potential is measured.
What attributes does the input sinusoidal signal have in EIS?
-The input sinusoidal signal has three main attributes: it is time-dependent, has an amplitude (indicating the size of the potential), and has an angular frequency (which indicates how frequently the signal oscillates).
What is the phase shift or phase angle in an EIS experiment?
-The phase shift or phase angle refers to the offset between the input sinusoidal potential and the output sinusoidal current in an EIS experiment. Although both signals share the same angular frequency, the output current may lag behind or lead the input potential.
What is the purpose of applying a Fourier Transform to the data in EIS?
-The Fourier Transform is used to convert the time-domain data (which is measured over time) into the frequency domain (measured in Hertz or inverse seconds). This transformation allows for a more detailed analysis of the system's impedance at different frequencies.
How does EIS relate to Ohm's Law?
-EIS uses a similar concept to Ohm’s Law, but instead of resistance, it measures impedance (Z) in AC systems. Impedance is the opposition to current flow in an AC system, analogous to resistance in DC circuits.
What are the two main measurable quantities obtained from EIS?
-The two main measurable quantities from EIS are the magnitude of the impedance (which represents the ratio of potential to current amplitudes) and the phase angle (which indicates the phase shift between the potential and the current).
What is a Bode plot in EIS?
-A Bode plot is a graphical representation of the magnitude of impedance and the phase angle as a function of frequency. It helps to analyze the impedance behavior of a system across a range of frequencies.
What is a Nyquist plot in EIS?
-A Nyquist plot is another graphical representation used in EIS where the real impedance is plotted on the X-axis and the negative imaginary impedance on the Y-axis. This plot provides a visual representation of the impedance data in a complex plane.
How can EIS be used to probe different electrochemical phenomena?
-EIS can probe different electrochemical phenomena because each phenomenon (e.g., double layer charging, diffusion, etc.) occurs at characteristic frequencies. By applying sinusoidal perturbations at these frequencies, EIS allows for the separation and identification of these processes, even when they happen simultaneously.
Outlines

This section is available to paid users only. Please upgrade to access this part.
Upgrade NowMindmap

This section is available to paid users only. Please upgrade to access this part.
Upgrade NowKeywords

This section is available to paid users only. Please upgrade to access this part.
Upgrade NowHighlights

This section is available to paid users only. Please upgrade to access this part.
Upgrade NowTranscripts

This section is available to paid users only. Please upgrade to access this part.
Upgrade NowBrowse More Related Video

Mecanismo de substituição aromática eletrofílica | Química orgânica | Khan Academy
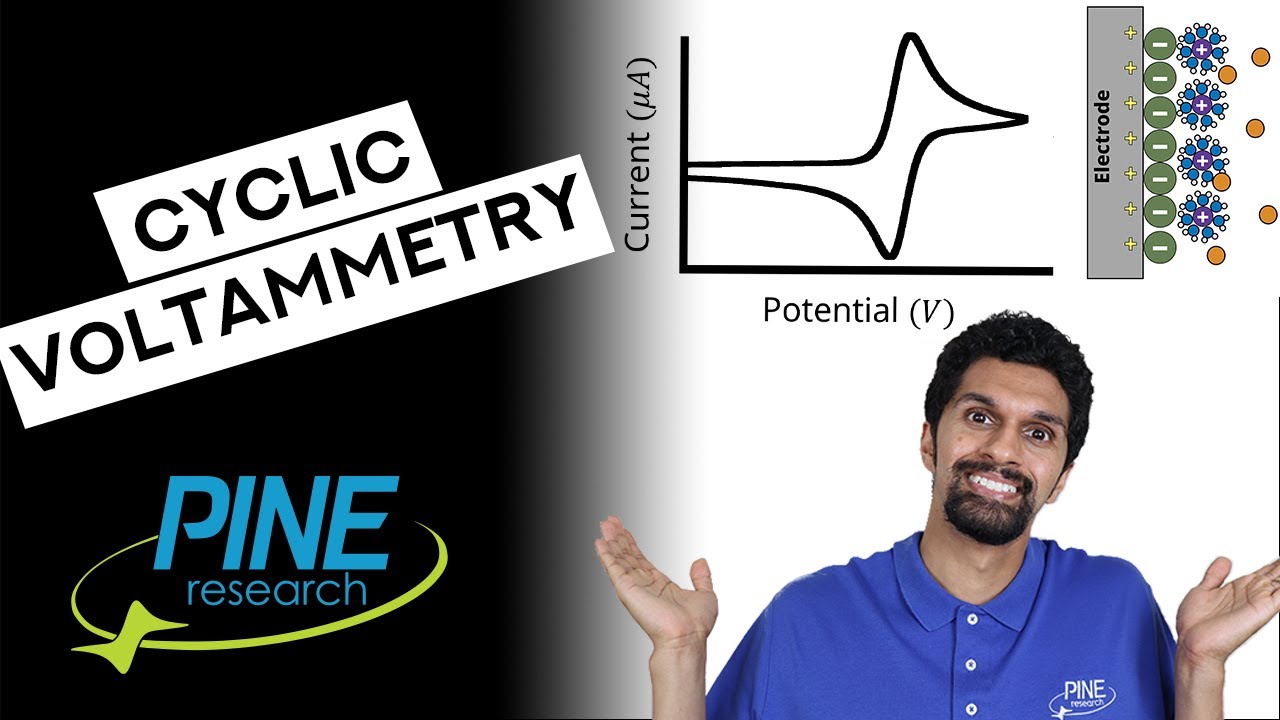
Introduction to Cyclic Voltammetry

ELECTROCHEMICAL MACHINE (ECM): Construction and working of electrochemical Machining process.

Corrosion : Electrochemical Cell or Corrosion Cell (Chapter 3) (Animation)
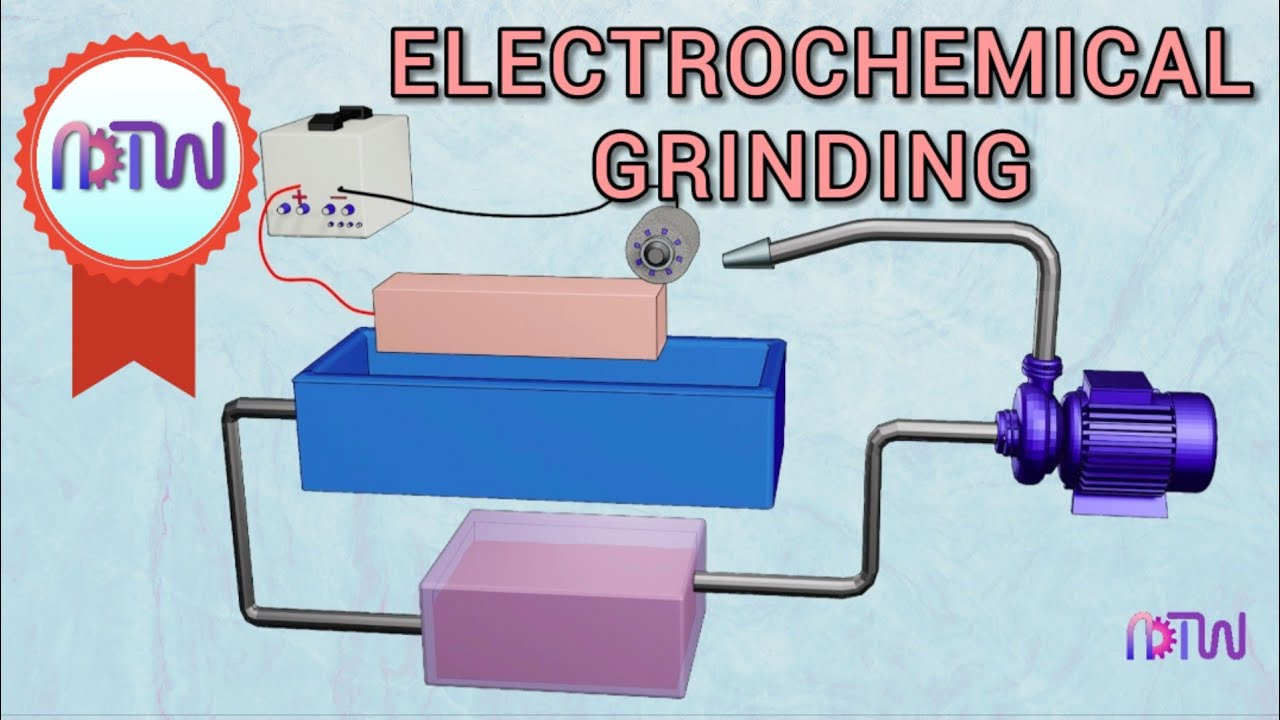
Electrochemical Grinding Process | How electrochemical grinding works

20.1 Introduction to Electrochemistry
5.0 / 5 (0 votes)