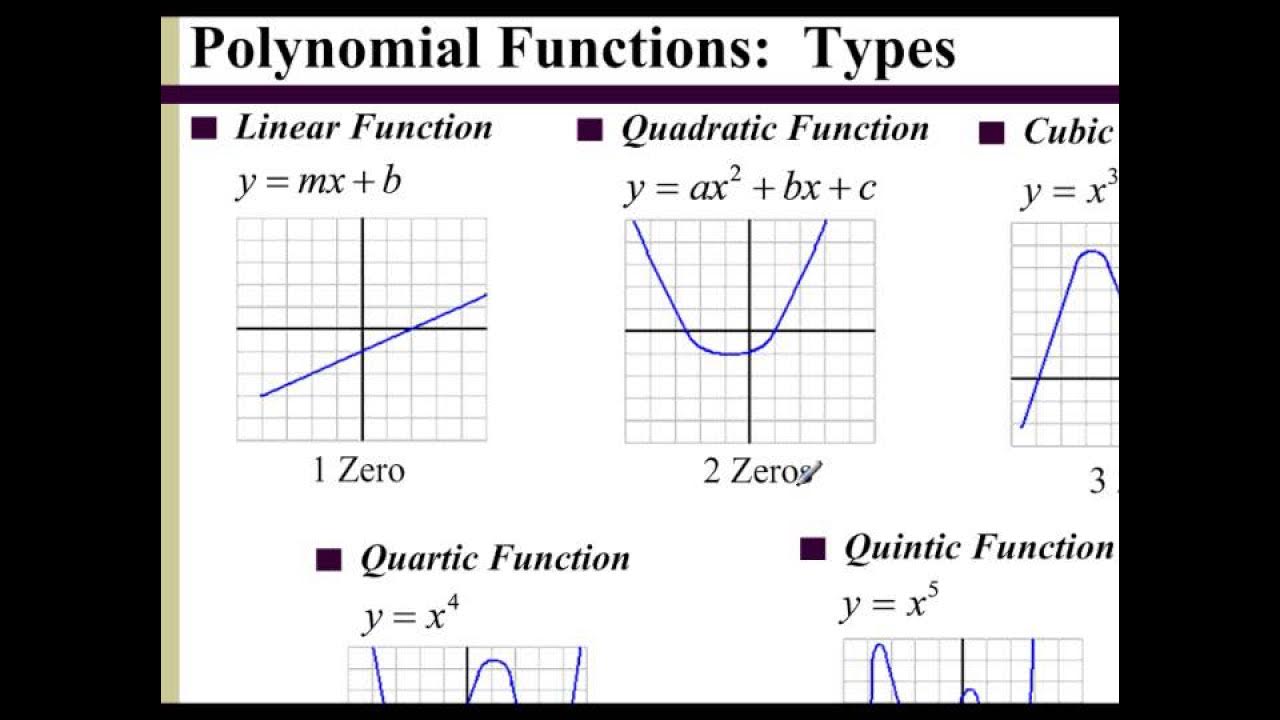
Graphs of Polynomials: Identification and Characterization
Summary
TLDRThis video explores the identification and graphical representation of polynomial functions. It emphasizes the smooth and continuous nature of polynomial graphs, where abrupt changes or sharp corners disqualify a function from being a polynomial. Through various examples, the video demonstrates how to assess graphs for polynomial characteristics, enabling viewers to confidently determine if a function is polynomial and understand its properties. Additionally, it introduces the concept of identifying zeros in polynomial functions, laying the groundwork for further exploration in algebra.
Takeaways
- 😀 Polynomial functions are characterized by smooth curves without sharp corners.
- 😀 A graph of a polynomial can be drawn continuously without lifting the pen.
- 😀 Continuity is a key feature of polynomial functions; they have no breaks in their graphs.
- 😀 If a graph has a sharp corner, it cannot be classified as a polynomial function.
- 😀 Smooth transitions in graphs indicate that the function is likely a polynomial.
- 😀 Identifying whether a graph represents a polynomial function involves checking for smoothness and continuity.
- 😀 Linear and quadratic functions are examples of polynomial functions.
- 😀 Not all smooth curves are polynomials; the graph must also be continuous.
- 😀 The ability to identify the zeros of a polynomial function is crucial for further analysis.
- 😀 The video guides viewers on how to determine if a function is a polynomial by examining its graphical properties.
Q & A
What is the main objective of the mission discussed in the video?
-The main objective is to determine if a given function is a polynomial based on its graph and to derive the algebraic equation of that polynomial.
What are the two key tasks involved in the mission?
-The two key tasks are: 1) Identifying whether the given graph represents a polynomial function, and 2) Determining how the graph looks if provided with the polynomial's equation.
What features distinguish polynomial graphs from non-polynomial graphs?
-Polynomial graphs are characterized by being smooth curves without sharp corners and are continuous, allowing them to be drawn without lifting the pen.
How does the video define a smooth curve in the context of polynomial functions?
-A smooth curve is defined as one that can be drawn without any abrupt changes in direction or sharp edges.
What does it mean for a graph to be continuous?
-A continuous graph means that there are no breaks or gaps, allowing it to be drawn in one motion without lifting the drawing instrument.
Can you provide an example of a graph that is not a polynomial function?
-Yes, a graph with sharp corners or breaks, like one that requires lifting the pen to draw, does not qualify as a polynomial function.
What type of polynomial functions did the video mention as examples?
-The video specifically mentions linear functions and quadratic functions as examples of polynomial functions.
What should you look for when evaluating whether a graph represents a polynomial function?
-Look for smooth transitions, absence of sharp corners, and ensure the graph is continuous without breaks.
What are zeros of a polynomial function, and why are they important?
-Zeros of a polynomial function are the values where the function equals zero. They are important for understanding the function's behavior and roots.
How can you summarize the relationship between polynomial functions and their graphs?
-Polynomial functions are represented by smooth, continuous graphs without sharp corners, and their graphs can help identify the polynomial's characteristics and behavior.
Outlines

This section is available to paid users only. Please upgrade to access this part.
Upgrade NowMindmap

This section is available to paid users only. Please upgrade to access this part.
Upgrade NowKeywords

This section is available to paid users only. Please upgrade to access this part.
Upgrade NowHighlights

This section is available to paid users only. Please upgrade to access this part.
Upgrade NowTranscripts

This section is available to paid users only. Please upgrade to access this part.
Upgrade NowBrowse More Related Video

CBSE Class 11 Maths Project-Relations & Functions

Lesson 6.3 - Identifying a Polynomial Function from the Graph

FUNÇÃO AFIM | FUNÇÃO DO 1º GRAU | LEI DE FORMAÇÃO | AULA 1 - Professora Angela Matemática

FASE 4 - VIDEOAULA 1 - MATEMÁTICA - DESAFIO CRESCER SAEB (3ª SÉRIE)

Grade 10 - Illustrating and graphing polynomial functions | SirABC

Lec 38 - Graphs of Polynomials: Multiplicities
5.0 / 5 (0 votes)