Wk 3A part1
Summary
TLDRIn this educational session, the speaker highlights the fundamental principles of statistical analysis, emphasizing the importance of data visualization through plots like histograms and box plots. They recount an experience with a PhD student struggling to analyze fungicide application data, showcasing the necessity of good data management and the initial steps of creating plots. Through log transformations and factor analysis, they illustrate the critical role of basic statistical methods in conveying scientific arguments, reinforcing that these foundational skills are vital throughout one's academic journey.
Takeaways
- 📊 Visualization is a fundamental step in data analysis, crucial for convincing others of your arguments.
- 📚 Combining visual, written, and tabular data is essential for a comprehensive analysis.
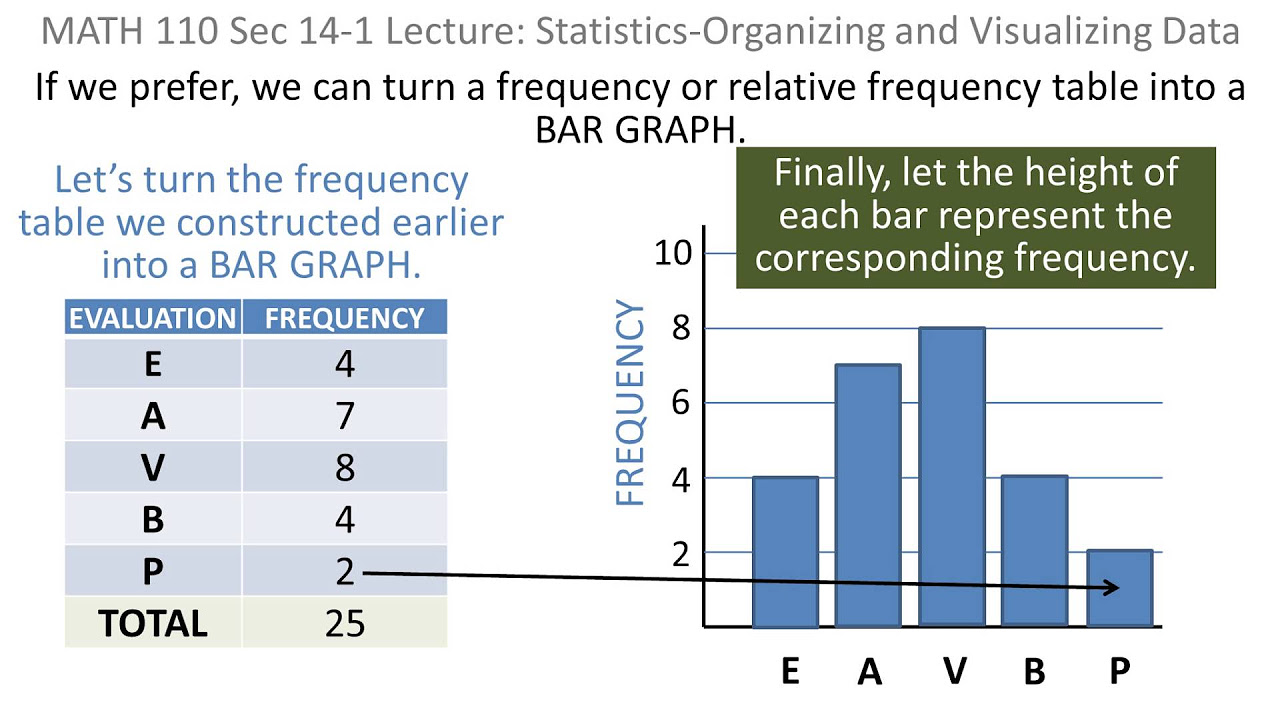
- 🔍 Histograms and box plots are basic tools used throughout the data analysis process, even at advanced levels.
- 🔢 Understanding logarithms and diversity indices is important for measuring and monitoring data diversity.
- 🎯 Technical knowledge in mathematics is valuable for developing metrics that hold policymakers accountable.
- 🧪 Data analysis is a scientific process, beginning with exploratory visualization.
- 💾 Good data management practices, such as saving and organizing script files, are crucial for effective analysis.
- 📈 Using appropriate transformations, like log transformations, can help reveal insights in data.
- 📊 Identifying the type of variable (continuous vs. factor) is essential for choosing the right analysis method.
- 🔗 Fitting trend lines and uncertainty bands is an advanced step that can enhance data interpretation.
Q & A
What are the fundamental building blocks of statistical analysis mentioned in the script?
-The fundamental building blocks of statistical analysis include visual plots of data, written analysis, and data tables.
Why is it important to create a visual plot of data?
-Creating a visual plot is essential because it helps to convince others of your argument or propositions by providing a clear representation of the data.
What role do logarithms and diversity indices play in data analysis?
-Logarithms and diversity indices serve as technical tools that help in measuring and monitoring diversity, which is crucial for holding policymakers accountable for measurable objectives.
What was the initial issue faced by the PhD student in the script?
-The PhD student was unsure how to analyze their data after conducting an experiment on fungicide application rates.
What first step did the speaker take to assist the student with their data?
-The speaker first loaded the student's data into RStudio to visualize it, creating a simple plot to understand the data better.
How did the speaker identify the structure of the data?
-The speaker observed a cluster of observations around zero in the plot and decided to apply a log transformation to better analyze the data.
What type of variable did the speaker determine the student's data represented?
-The speaker determined that the student's data represented a factor variable with ordered levels corresponding to application rates.
What was the goal of the analysis the student was conducting?
-The student's goal was to determine the LD50, which is the application rate of fungicide that would kill half of the test organisms.
What methods did the speaker suggest using to further analyze the data?
-The speaker suggested fitting trend lines and uncertainty bands to the data to summarize the findings better.
What takeaway does the speaker provide regarding the importance of fundamental principles in data analysis?
-The speaker emphasizes that the fundamental principles learned in the course are essential tools that will continue to be used in scientific analysis, regardless of how advanced one becomes in their field.
Outlines

This section is available to paid users only. Please upgrade to access this part.
Upgrade NowMindmap

This section is available to paid users only. Please upgrade to access this part.
Upgrade NowKeywords

This section is available to paid users only. Please upgrade to access this part.
Upgrade NowHighlights

This section is available to paid users only. Please upgrade to access this part.
Upgrade NowTranscripts

This section is available to paid users only. Please upgrade to access this part.
Upgrade NowBrowse More Related Video

MATERI STATISTIKA BOX PLOT DAN DOT PLOT KELAS X

Data Visualization Tutorial For Beginners | Big Data Analytics Tutorial | Simplilearn
Statistics: 01 Organizing and Visaulizing Data
Descriptive statistics and data visualisation. An introduction to statistics and working with data
Must know Visualization in Statistics | Descriptive Statistics | Ultimate Guide !! | Part 10

Types Of Plot By Purpose - Introduction
5.0 / 5 (0 votes)