Types Of Plot By Purpose - Introduction

Skills Pragati
16 Feb 202306:05

Summary

TLDRThe video introduces different types of plots used for data visualization and their purposes in data analysis. It covers six key objectives: identifying relationships, measuring deviation, ranking, understanding distribution, analyzing composition, and tracking changes, particularly in time series data. The speaker explains various plot types like scatter plots, histograms, and time series plots, and highlights how each can be used to achieve specific analytical goals. Future sessions will focus on coding these plots using a Jupyter notebook. Viewers are encouraged to follow along to learn practical visualization techniques step-by-step.

Takeaways

  • πŸ“Š Data visualization involves using different types of plots for specific purposes in data analysis.
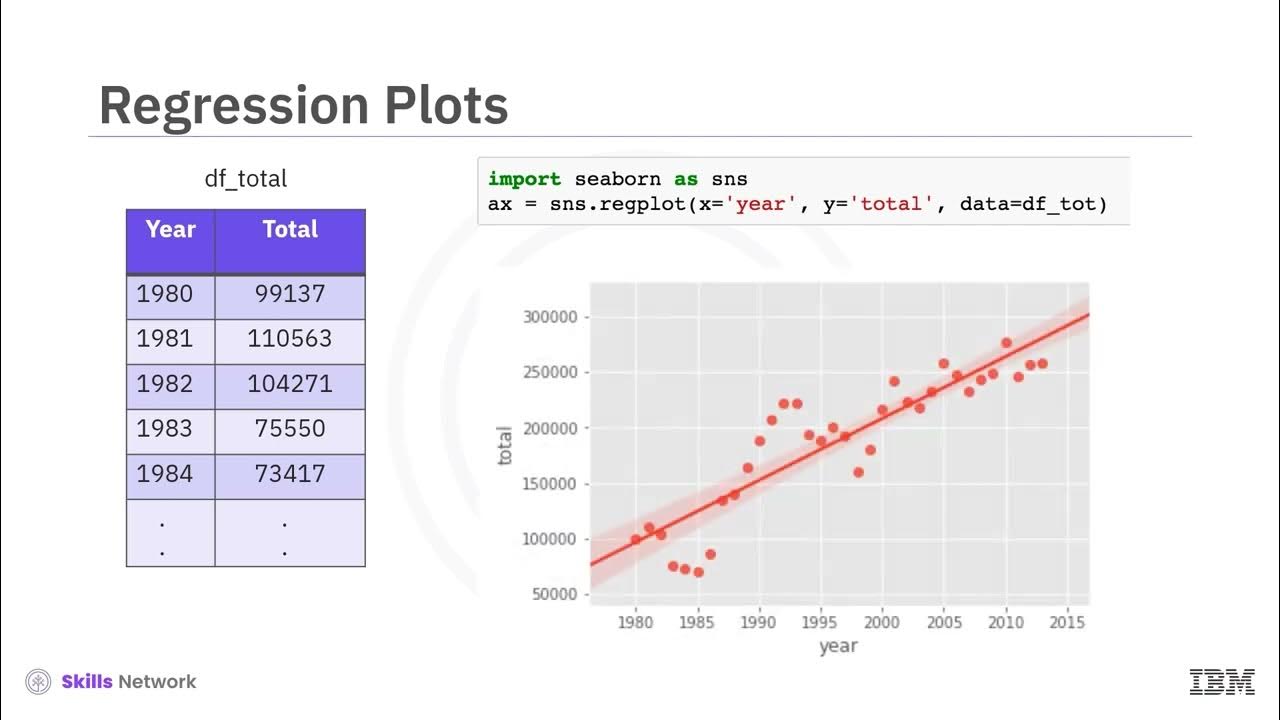
  • πŸ“‰ One primary purpose is identifying relationships between two variables using correlation plots like scatter plots and heat maps.
  • πŸ“ˆ Deviation plots, such as diverging bars and dot plots, help understand variance within a dataset.
  • πŸ“‹ Ranking plots, like ordered bar charts and dot plots, are used to rank data within a dataset.
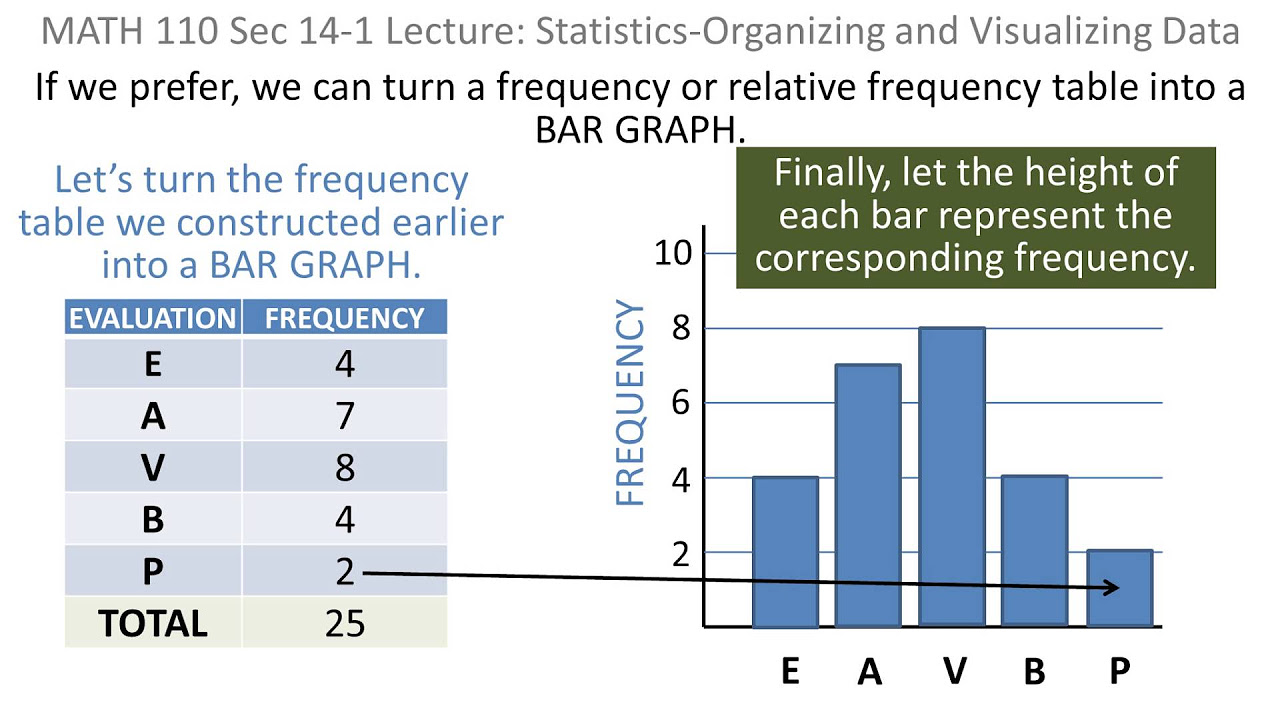
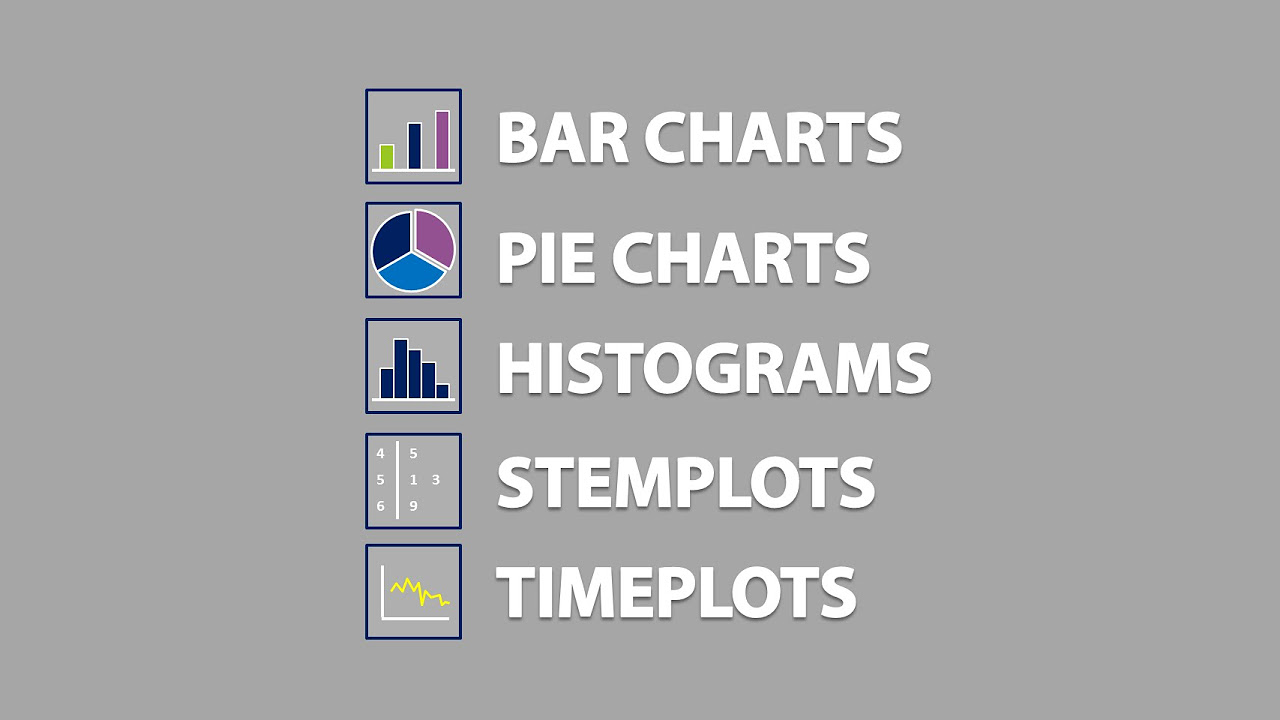
  • πŸ“ Distribution plots, such as histograms, density plots, and box plots, help identify how continuous and categorical data are distributed.
  • πŸ₯§ Composition plots, like pie charts and treemaps, are used to understand the makeup of a dataset.
  • πŸ•°οΈ Time series plots are important for tracking changes over time, especially for time-series data.
  • πŸ”§ Each type of plot serves a specific purpose, from understanding correlations to analyzing changes over time.
  • πŸ“ Future sessions will focus on coding and creating each type of plot in Jupyter notebooks.
  • πŸ‘¨β€πŸ’» The session emphasized the practical application of different plotting techniques in data visualization.

Q & A

  • What is the primary purpose of using plots in data visualization?

    -The primary purpose of using plots in data visualization is to visualize data effectively, making it easier to understand patterns, trends, relationships, distributions, and compositions within a dataset.

  • How can plots help in identifying the relationship between two variables?

    -Plots such as scatter plots, correlation plots, and heatmaps help in identifying the relationship between two variables by visually representing how one variable changes with respect to another.

  • What type of plot is commonly used to identify variance within a dataset?

    -To identify variance or deviation within a dataset, diverging bar plots and diverging dot plots are commonly used. These plots help in visualizing how much a data point deviates from a central value.

  • How can ranking be represented within a dataset?

    -Ranking within a dataset can be represented using order bar charts and dot plots. These plots help in visualizing the order or rank of data points based on certain metrics, such as maximum or mean values.

  • What are the key plots used to visualize data distribution?

    -The key plots used to visualize data distribution include histograms, density plots, and box plots. These plots help in understanding how continuous or categorical variables are distributed across a dataset.

  • What is the role of composition plots in data visualization?

    -Composition plots, such as pie charts, treemaps, and bar charts, are used to visualize the composition of different categories or elements within a dataset. These plots help in understanding the proportion of each component in relation to the whole.

  • Which plots are most useful for analyzing time-series data?

    -For time-series data, time series plots and time series decomposition plots are most useful. These plots help in visualizing changes, trends, and patterns over time within the dataset.

  • What is a scatter plot with a line of best fit used for?

    -A scatter plot with a line of best fit is used to visualize the relationship between two variables while also showing the overall trend or pattern through a line that best represents the data points.

  • How do you visualize both continuous and categorical variables in data analysis?

    -Continuous variables are often visualized using histograms and density plots, while categorical variables are visualized using bar charts, pie charts, and treemaps to show distribution and composition.

  • What are the key topics covered in the session related to data visualization?

    -The session covers the purposes of data visualization, including identifying relationships, deviations, rankings, distributions, compositions, and changes within datasets. It also discusses various types of plots used for these purposes, such as scatter plots, histograms, bar charts, pie charts, and time series plots.

Outlines

00:00

πŸ“Š Introduction to Plotting and Data Visualization

In this introductory paragraph, the speaker welcomes the audience and sets the stage for a discussion on various types of plots and their uses in data visualization. The primary focus is on six key purposes for plotting in data analysis: relationship identification, deviation, ranking, distribution, composition, and changes, particularly in time series data. The speaker explains that plots help analyze relationships between variables, variance in datasets, and patterns in time series, emphasizing the importance of these visual tools in data analysis.

05:02

πŸ“‰ Exploring Plot Types for Relationships, Deviation, and Ranking

This paragraph dives deeper into the specific plots used for various purposes in data visualization. For identifying relationships between variables, scatter plots and other similar plots (scatter plot with a line of best fit, counts plot, marginal box plot, correlogram, heat map, pairwise plot) are introduced. For analyzing deviations, diverging bar and dot plots are highlighted as useful tools. When it comes to ranking, the speaker mentions order bar charts and dot plots, which help rank data within a dataset. These examples set the groundwork for the detailed exploration of plot types in future sessions.

πŸ“ˆ Understanding Distribution and Common Plotting Techniques

This section focuses on plots used to analyze distributions in datasets, particularly during data analysis. The speaker emphasizes the use of histograms, a traditional but effective method, to understand both continuous and categorical data distribution. Other tools like density plots, density curves with histograms, and box plots are also mentioned as useful for gaining insights into data distribution. The speaker emphasizes that distribution analysis is a critical step in data visualization.

πŸ“Š Analyzing Composition and Time Series Data

The final paragraph covers composition and time series analysis. Pie charts and tree maps are discussed as traditional and effective tools to identify the composition of data. Bar charts are also highlighted as a useful way to visualize composition. The paragraph closes by emphasizing the significance of time series plots and decomposition plots in analyzing trends over time in datasets. The speaker announces that in upcoming sessions, they will provide practical coding examples for each type of plot discussed.

Mindmap

Keywords

πŸ’‘Data Visualization

Data visualization refers to the graphical representation of information and data. In the video, it is presented as a key tool in data analysis to help understand the relationship, distribution, or composition of variables. Different plots, such as scatter plots, histograms, and pie charts, are used for this purpose.

πŸ’‘Correlation

Correlation is the statistical measure that describes the extent to which two variables are related. The video emphasizes correlation plots like scatter plots, heat maps, and pairwise plots to visualize the relationship between two or more variables. For example, a scatter plot with a line of best fit is used to show how one variable changes with another.

πŸ’‘Deviation

Deviation refers to how much variation or difference exists within a dataset. The video mentions the importance of identifying deviation to understand variance using plots like diverging bar and dot plots. These plots help identify the spread or outliers in data.

πŸ’‘Ranking

Ranking in data analysis refers to the ordering of data points based on specific criteria such as highest or lowest values. The video introduces order bar charts and dot plots as tools for visualizing the ranking of data within a dataset, which helps to understand things like maximum and mean ranges.

πŸ’‘Distribution

Distribution in data visualization is the way values are spread across a dataset. The video explains that plots such as histograms, density plots, and box plots help identify how continuous or categorical variables are distributed within a dataset, which is essential for understanding data patterns.

πŸ’‘Composition

Composition in data visualization refers to understanding the parts that make up a whole. The video discusses pie charts, tree maps, and bar charts as tools to display the composition of different categories within a dataset, for example, showing the proportion of different elements in a pie chart.

πŸ’‘Time Series Data

Time series data refers to data points collected or recorded at specific time intervals. The video highlights the importance of time series plots and decomposition plots for visualizing changes over time, which is especially useful when analyzing trends and patterns in time-sensitive data.

πŸ’‘Scatter Plot

A scatter plot is a type of graph that shows the relationship between two variables by displaying points at the intersection of their values. In the video, scatter plots are used to identify correlations between variables, often with a line of best fit added to visualize trends.

πŸ’‘Histogram

A histogram is a plot used to show the distribution of a dataset by grouping data into bins or intervals. The video mentions histograms as an old yet effective method to display the distribution of continuous data, providing a visual summary of the frequency of data points.

πŸ’‘Heat Map

A heat map is a data visualization tool that uses color to represent the magnitude of values in a matrix or table. In the video, heat maps are discussed in the context of showing relationships or correlations between variables, where darker or lighter shades indicate stronger or weaker correlations.

Highlights

Introduction to the session focusing on various types of plots and their usage in data visualization.

Plotting is used for multiple purposes in data analysis, with six major purposes identified.

First purpose of plotting is identifying the relationship between two variables using correlation plots like scatter plots.

Correlation plots provide insights into how one variable changes with respect to another.

The second purpose is to understand deviation within a dataset, with specific plots like diverging bars and diverging dot plots.

Third purpose is ranking within a dataset, with order bar charts and dot plots used to determine maximum, mean, and other rankings.

Distribution plots are used to examine how continuous or categorical variables are distributed within a dataset.

Histogram is an old and effective method for visualizing the distribution of data.

Other distribution plots include density plots, density curves with histograms, and box plots.

Composition is another purpose, with pie charts, tree maps, and bar charts used to understand the composition of data.

The last major purpose of plotting is identifying changes in a dataset, especially in time series data.

Time series plots and decomposition plots are effective for analyzing trends in time series data.

Scatter plots can be extended with lines of best fit, counts plots, and marginal box plots for deeper analysis.

Correlograms, heatmaps, and pairwise plots are used to explore relationships between more than two variables.

The session concludes with a promise of coding different types of plots in the next sessions, focusing on best practices for data visualization.

Transcripts

play00:00

hello guys welcome back now from this

play00:02

session onwards we are going to discuss

play00:03

about various types of plot and their

play00:05

usage so let's start our discussion so

play00:08

guys we already know about that lot is

play00:10

being used for data visualization and we

play00:12

can use these lots for different

play00:13

purposes so let's discuss about what are

play00:16

the purpose we are having in data

play00:18

analysis so easily we are having six

play00:20

type of purpose for which we are using

play00:22

the different kind of plot the first

play00:23

thing we want to identify the

play00:25

relationship between two variables and

play00:28

the plots under correlation is used to

play00:30

visualize the relationship between two

play00:32

or more variables and correlation plot

play00:34

gives us information like how does one

play00:36

variable change with respect to another

play00:38

variable now proceeding to the another

play00:40

purpose that is deviation we want to

play00:42

identify how much variance we are having

play00:45

within the given data set then we use

play00:47

various kinds of Aviation plots now

play00:49

let's proceed further and discuss about

play00:51

another purpose that is ranking sometime

play00:53

it is required to get the information

play00:55

about the ranking within a given data

play00:58

set information like what is the maximum

play01:00

range what is the mean range so there

play01:02

are certain plots which help us to

play01:04

identify the ranking of the data within

play01:06

the given data set so let's proceed

play01:08

further and discuss about distribution

play01:10

so guys while doing the data analysis

play01:12

sometime we required to know the

play01:14

distribution of the data within the

play01:16

given data set how the continuous

play01:18

variable is distributed within the given

play01:20

data set same way if you want to

play01:22

identify the distribution of the

play01:24

categorical variable we will be using

play01:26

various type of plot to identify the

play01:28

distribution within the given data set

play01:30

now let's discuss about another purpose

play01:32

that is composition sometime within data

play01:34

analysis it is required to identify the

play01:37

composition detail within the given data

play01:39

set so to get the information about the

play01:42

composition we will be using various

play01:44

plots that we will look into now at last

play01:46

but not the least we will be using

play01:48

various plots to identify the changes

play01:51

within the given data set and when we

play01:53

are dealing with any kind of Time series

play01:55

data and on that time we will be using

play01:58

various plots which will be captured

play02:00

sharing or say which will be visualizing

play02:02

the changes within the data set and this

play02:04

is one of the important purpose when we

play02:06

are dealing with the time series data so

play02:08

guys this is about the purpose of the

play02:10

data visualization or say purpose of the

play02:12

plotting now let's discuss about what

play02:14

are the law which falls into each

play02:16

category so let's jump into the Jupiter

play02:19

notebook and we will discuss one by one

play02:21

in this session and next session onward

play02:23

we will write the code for different

play02:25

types of plots so guys the first purpose

play02:27

we have discussed about correlation and

play02:29

the plots which belongs to this is the

play02:31

scatter plot we are going to write the

play02:33

code for a scatter plot in the next

play02:35

session in this session we will discuss

play02:37

about what are the plots available in

play02:39

each of the category one by one so with

play02:42

the scatter plot and other plots which

play02:44

belongs to this category like a scatter

play02:46

plot with line of best fit counts plot

play02:49

marginal box plot correlogram heat map

play02:51

pairwise plot so all this plot is used

play02:54

to identify the relationship between two

play02:57

variables and more than two variables

play02:58

which we will look into but remember

play03:00

that whenever you want to identify the

play03:03

relationship between two variables then

play03:05

these are the plots is going to be very

play03:07

helpful to visualize the relationship

play03:09

now let's proceed further there is other

play03:11

purpose which we have discussed is the

play03:13

deviation within deviation there is

play03:15

something called diverging bus and

play03:17

diverging Dot Plot so this is very

play03:18

helpful to identify the deviation within

play03:21

the data set that means suppose if you

play03:23

want to identify the variance within the

play03:25

data set then it is going to be very

play03:27

helpful these two plots and next we have

play03:29

discussed about ranking so identify the

play03:31

ranking within the given data set we are

play03:34

going to look into order bar chart and

play03:36

Dot Plot so these two plot is very

play03:38

helpful to identify the ranking within

play03:40

the given data set now let's proceed

play03:42

further and we have also discussed about

play03:44

the distribution distribution generally

play03:46

we use very much within data analysis we

play03:49

need to identify the distribution of the

play03:51

data within the given data set so for

play03:54

that reason you will find there are

play03:55

various plots we will be using two major

play03:57

thing we generally do first one is the

play04:00

correlation identification when we do

play04:02

the data analysis and the second one we

play04:04

generally do the distribution where we

play04:06

want to identify the distribution of the

play04:08

continuous variable then we want to

play04:10

identify the distribution of the

play04:12

categorical variable then we are going

play04:14

to use histogram histogram is one of the

play04:17

old methods and very effective way to

play04:19

identifying the distribution within the

play04:21

given data set along with that we will

play04:23

also discuss about density plot we will

play04:25

look into how to create density plot we

play04:27

will also look into density curves with

play04:29

histogram and at last we will also

play04:31

discuss about the box plot box plot is

play04:33

very helpful also identify the

play04:35

distribution within the given data set

play04:37

for the next purpose we have discussed

play04:39

composition where we want to identify

play04:42

the composition detail within the given

play04:44

data set so for that reason we are going

play04:46

to use pie chart pie chart is also old

play04:49

methodology which you have seen many

play04:51

places where you want to know the

play04:53

composition of different kind of data

play04:55

within the given data set so we use

play04:57

ichart there is another method which we

play04:59

use for composition that is tree map

play05:02

tree map is also very useful way of

play05:04

identifying the composition within the

play05:06

given data set the third category of

play05:08

chart we are going to look into our plot

play05:10

we are going to look into is the bar

play05:12

chart which you already aware about most

play05:14

of the places you have seen the bar

play05:16

chart that is also very useful method to

play05:18

identify the composition and the last

play05:20

purpose we have discussed that is very

play05:22

useful when we are dealing with the time

play05:24

series data set and on that time

play05:26

basically we are using time series plot

play05:29

we will look into how to create time

play05:31

series plot we are also going to discuss

play05:33

about time series decomposition plot it

play05:35

is very effective rotting technique to

play05:37

identify the trend within the given data

play05:40

set that we will look into so overall

play05:42

these number of plotting Technique we

play05:44

are going to look into or these number

play05:46

of plots we are going to look into and

play05:48

we will look into the best practices to

play05:50

write the code or data visualization so

play05:52

on this note I am stopping over here

play05:54

next session onwards I am going to start

play05:57

writing the code for each of the plots

play05:59

we want to follow along you can follow

play06:01

with me so see you in the next session

play06:02

till then bye bye take care

Rate This
β˜…
β˜…
β˜…
β˜…
β˜…

5.0 / 5 (0 votes)

Related Tags
Data VisualizationPlot TypesCorrelationTime SeriesAnalysis TechniquesData SciencePython CodingJupyter NotebookCharting ToolsData Plots