STATISTIKA PENELITIAN # 7 # (MATERI) TENDENSI SENTRAL (rerata, median, dan modus)
Summary
TLDRIn this video, the speaker explains the concept of central tendency, focusing on the measures of mean, median, and mode. He discusses the differences between population parameters and sample statistics, emphasizing the importance of using correct notations like μ for population mean and x̄ for sample mean. The video covers how to calculate each measure for both individual and grouped data, including formulas and step-by-step examples. The speaker aims to make understanding central tendency and basic statistical concepts easier, encouraging viewers to approach statistics confidently.
Takeaways
- 📊 Central tendency includes three main measures: mean, median, and mode.
- 🎯 Learning objectives: understanding mean, median, and mode, and knowing the difference between population and sample parameters.
- 📐 For population data, the mean is denoted by 'μ', while for sample data, it is denoted by 'x̄'.
- 📊 The median is the middle value of ordered data, and the mode is the most frequent value.
- 📏 In a population, 'N' denotes the total number of data points, while 'n' is used for samples.
- 📚 Mean for grouped data can be calculated using frequency distribution tables with the formula 'μ = Σfx / Σf'.
- 🔢 For finding the median in grouped data, first identify the median class, then apply the formula for calculating the median.
- 📈 For mode in grouped data, identify the class with the highest frequency, and use the formula to calculate the mode.
- 🔍 When working with data groups, determining class boundaries, intervals, and frequencies is essential for calculating mean, median, and mode.
- 📖 The video emphasizes the importance of understanding and applying statistical measures correctly, as well as the relevance of central tendency concepts learned in high school.
Q & A
What are the three main measures of central tendency discussed in the video?
-The three main measures of central tendency discussed in the video are the mean (Miu for population, x̄ for sample), median, and mode.
How is the mean of a population different from the mean of a sample?
-The mean of a population is denoted by Miu (µ), which is a parameter. In contrast, the mean of a sample is represented by x̄ (x-bar), which is an estimator. The formulas are similar, but the symbols differ to distinguish between population and sample data.
How do you calculate the median for a dataset?
-To calculate the median, first arrange the data in order. The median is the middle value if the number of data points is odd. If the number of data points is even, the median is the average of the two middle values.
What is the mode and how do you determine it?
-The mode is the value that appears most frequently in a dataset. To determine it, you count how often each value occurs and identify the one with the highest frequency.
What is the importance of distinguishing between population and sample in statistics?
-It is important to distinguish between population and sample because different symbols and calculations are used for each. Population data uses parameters like Miu (µ), while sample data uses estimators like x̄. This distinction ensures accurate interpretations in inferential statistics.
How is the mean calculated for grouped data?
-For grouped data, the mean is calculated using the formula Miu = Σ(fx) / Σ(f), where 'f' is the frequency of each class and 'x' is the midpoint of the class. A frequency table is often used to assist with these calculations.
How do you find the median for grouped data?
-To find the median for grouped data, first identify the median class by determining where the middle data point falls in the cumulative frequency. Then, use the formula: Median = L + [(n/2 – F) / f] × i, where L is the lower boundary of the median class, F is the cumulative frequency before the median class, f is the frequency of the median class, and i is the class width.
What is the difference between the median and the mode for grouped data?
-The median for grouped data is found using cumulative frequencies to locate the middle value, while the mode is determined by identifying the class with the highest frequency and using the formula: Mode = L + [(f1 – f0) / ((f1 – f0) + (f1 – f2))] × i, where f1 is the frequency of the modal class, f0 is the frequency of the class before it, and f2 is the frequency of the class after it.
How do you calculate the mean when data is ungrouped?
-For ungrouped data, the mean is calculated by summing all the data values and dividing by the total number of data points. The formula is Miu = ΣX / n, where ΣX is the sum of all data points, and n is the number of data points.
What happens if the dataset is even in size when calculating the median?
-If the dataset is even in size, the median is the average of the two middle values after the data is sorted.
Outlines

This section is available to paid users only. Please upgrade to access this part.
Upgrade NowMindmap

This section is available to paid users only. Please upgrade to access this part.
Upgrade NowKeywords

This section is available to paid users only. Please upgrade to access this part.
Upgrade NowHighlights

This section is available to paid users only. Please upgrade to access this part.
Upgrade NowTranscripts

This section is available to paid users only. Please upgrade to access this part.
Upgrade NowBrowse More Related Video
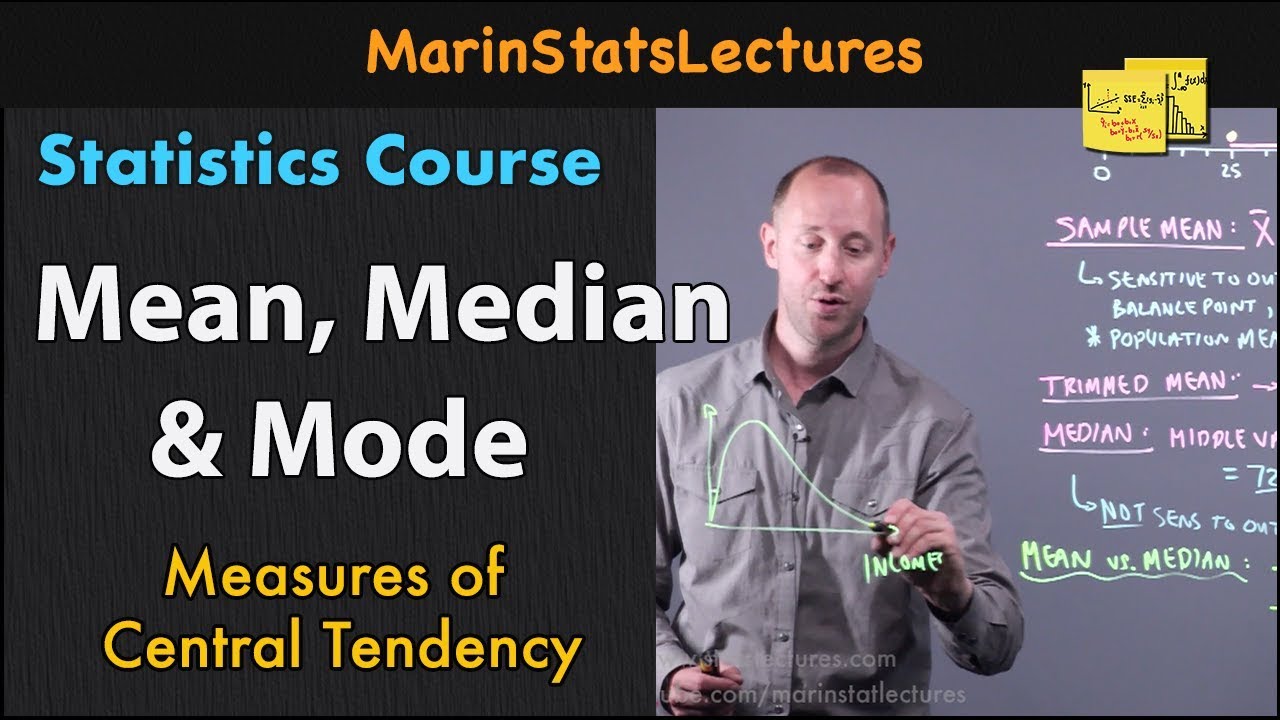
Mean, Median and Mode in Statistics | Statistics Tutorial | MarinStatsLectures
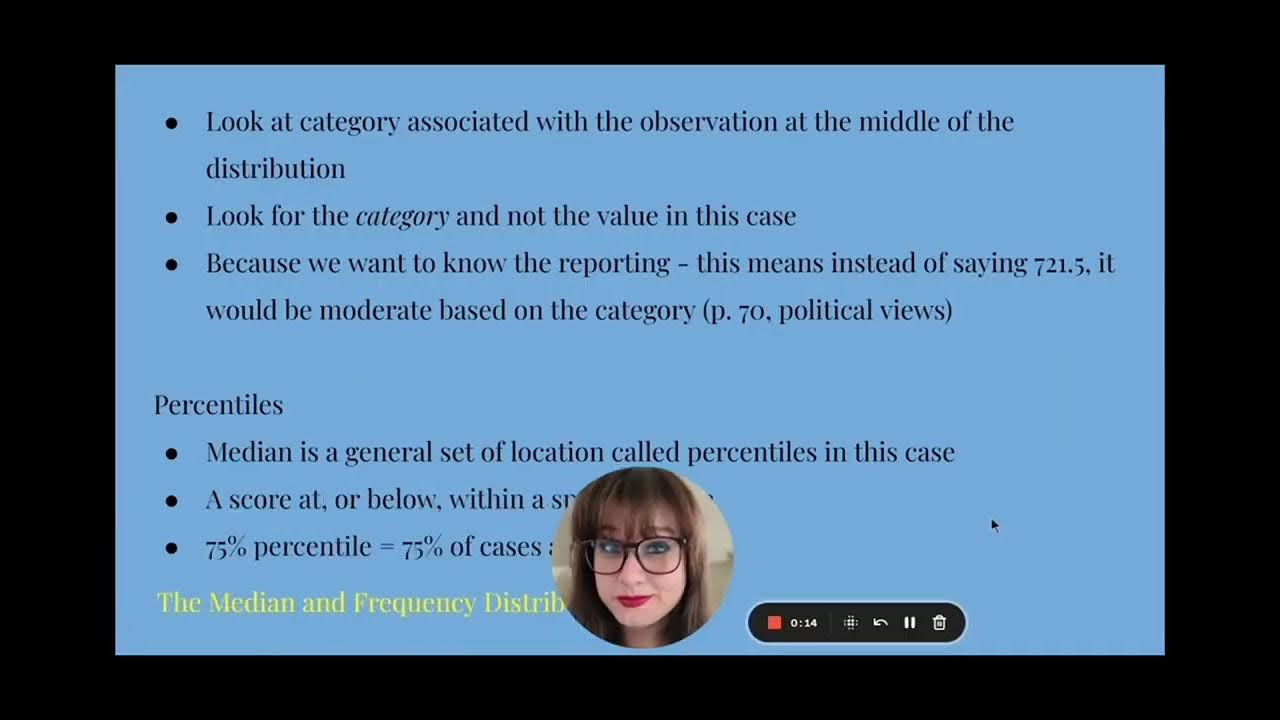
Ch 3 Lecture Video, Fall 2024: Measures of Central Tendency

Statistics: The average | Descriptive statistics | Probability and Statistics | Khan Academy
Ukuran Pemusatan Data Kelompok
2.5 Medidas descriptivas

Statistika Dasar Ukuran Pemusatan Data (Mean, Modus, Median) Data Tunggal dan Data Kelompok
5.0 / 5 (0 votes)