Exemplo de análise com gráfico de dispersão em serviços
Summary
TLDRThe script discusses a case study on utilizing scatter plots and linear regression analysis to improve sales processes. It highlights a company selling safety sensors where the high cost of visits leads to low returns. By analyzing data through scatter plots and regression, the company identifies a strong correlation between the number of visits and total expenses, leading to insights on reducing costs without negatively impacting sales. The case emphasizes the importance of data analysis in decision-making and process optimization.
Takeaways
- 📊 The use of a scatter plot graph and linear regression analysis can provide valuable insights into sales processes and customer behavior.
- 🔍 A real-case study was used to demonstrate how data analysis can help understand and improve sales performance and reduce costs.
- 💡 The company in the case study sells safety sensors and uses technical salespeople to visit clients' factories to assess their needs and provide quotes.
- 📈 The scatter plot graph helped identify a clear relationship between the number of visits and total expenses, showing that more visits lead to higher costs.
- 📊 There was no clear correlation between the number of visits and total sales, indicating that increasing visits does not necessarily lead to higher sales.
- 🛠️ The case study company made changes to their sales process, such as improving communication and using photo submissions, which led to a reduction in the number of visits and costs without negatively impacting total sales.
- 📈 Linear regression analysis showed that 86.90% of the variation in total expenses can be explained by the variation in the number of visits.
- 🔑 Stratification of products revealed that some products were less influenced by the number of sales, while others had a more significant impact on sales and profitability.
- 🚀 Focusing efforts on products that have a higher impact on sales and profitability can lead to a more efficient and cost-effective sales process.
- 💼 The importance of understanding customer needs and tailoring the sales approach accordingly was emphasized as a key takeaway for improving sales performance.
Q & A
What is the main topic of the script?
-The main topic of the script is the use of scatter plots and linear regression analysis in sales data to identify patterns and improve business processes.
What was the issue the company faced with their sales process?
-The company faced a high cost of prospection relative to their faturamento (revenue), with some sales visits being very costly and yielding low returns.
How did the company's sales process work initially?
-Initially, a technical salesperson would visit the customer's factory to analyze their needs and provide a quote for the required safety sensors. If the customer accepted the quote, the company would make the sale and revenue.
What data did the company have about their sales process?
-The company had data on the total revenue from each customer, the number of sales made to each customer, the total cost spent on visits, and the number of visits made.
What type of analysis did the speaker use to understand the data?
-The speaker used scatter plots and linear regression analysis to understand the relationship between various variables such as total revenue, number of visits, and total cost.
What was a key insight gained from the scatter plots?
-A key insight was that there was a clear relationship between the total cost and the number of visits, indicating that increasing the number of visits led to increased costs.
What did the linear regression analysis reveal about the relationship between the number of visits and total cost?
-The linear regression analysis revealed that 86.90% to 95% of the variation in total cost could be explained by the variation in the number of visits.
How did the company improve their sales process based on the analysis?
-The company improved their sales process by enhancing communication before visits, using photos and detailed information in forms to reduce the need for visits, which in turn reduced costs without negatively impacting total revenue.
What was the impact of these changes on the company's sales and costs?
-The changes led to a reduction in the number of visits, lower total costs, and did not negatively impact the total revenue, indicating a more efficient sales process.
What other insights were gained from further analysis of the data?
-Further analysis revealed that different types of products had different levels of impact on revenue per sale, with some products being more lucrative when sold in larger quantities and others being less affected by the number of sales.
What was the overall lesson learned from the data analysis?
-The overall lesson was that understanding the relationship between various sales variables through data analysis can lead to strategic improvements in the sales process, making it more efficient and cost-effective.
Outlines

This section is available to paid users only. Please upgrade to access this part.
Upgrade NowMindmap

This section is available to paid users only. Please upgrade to access this part.
Upgrade NowKeywords

This section is available to paid users only. Please upgrade to access this part.
Upgrade NowHighlights

This section is available to paid users only. Please upgrade to access this part.
Upgrade NowTranscripts

This section is available to paid users only. Please upgrade to access this part.
Upgrade NowBrowse More Related Video

Gráfico de dispersão no Excel

SPSS (16): Testing the five assumptions of linear regression in SPSS
Simple Linear Regression in R | R Tutorial 5.1 | MarinStatsLectures
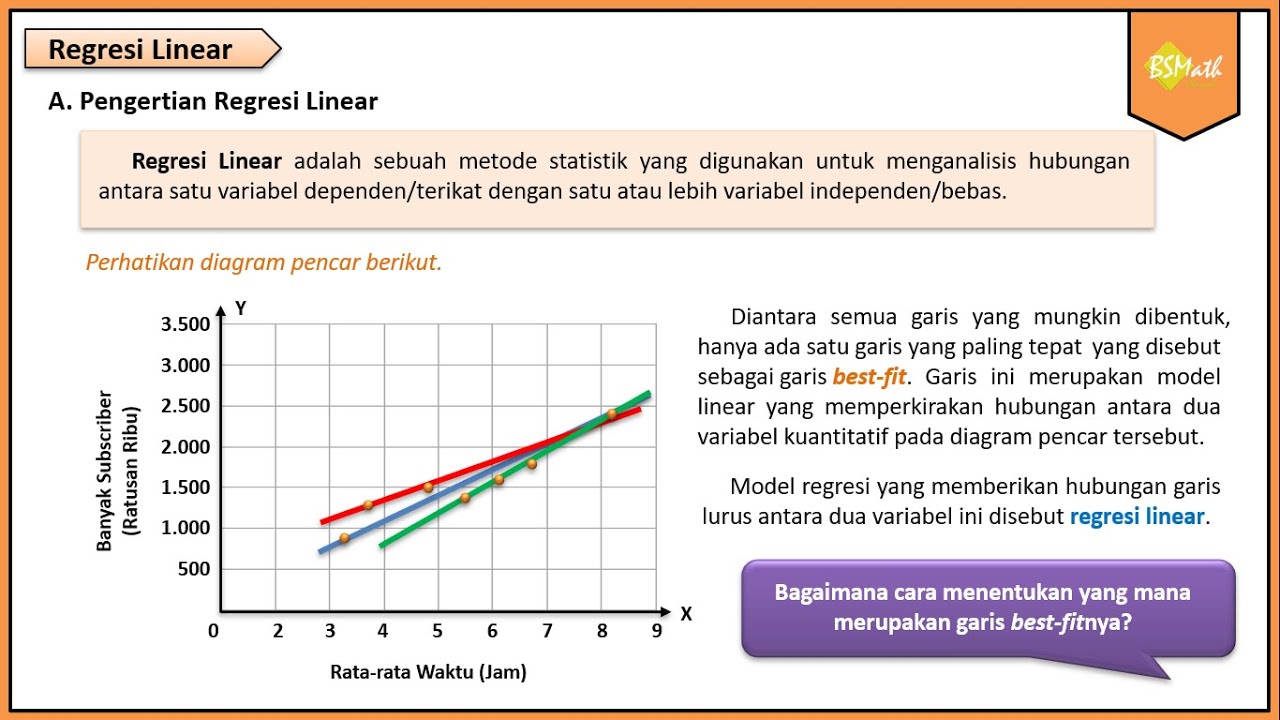
Pengertian Regresi Linear - Matematika Wajib Kelas XI Kurikulum Merdeka

Assumptions of Linear Regression | What are the assumptions for a linear regression model
Regresion Lineal
5.0 / 5 (0 votes)