O Diagrama de Ishikawa
Summary
TLDRThe transcript discusses the Ishikawa Diagram, a quality control tool used to identify and analyze potential causes of a problem. It emphasizes the importance of brainstorming with a team to pinpoint unwanted effects and their causes. The process involves identifying a problem, involving relevant people, and discussing potential root causes. The tool is not just for identifying micro-causes but also for validating ideas and generating practical changes. The speaker uses examples like car fuel consumption and hotel room issues to illustrate the application of the Ishikawa Diagram in problem-solving. The key takeaway is that the Ishikawa Diagram is a valuable tool for knowledge sharing and effective problem resolution.
Takeaways
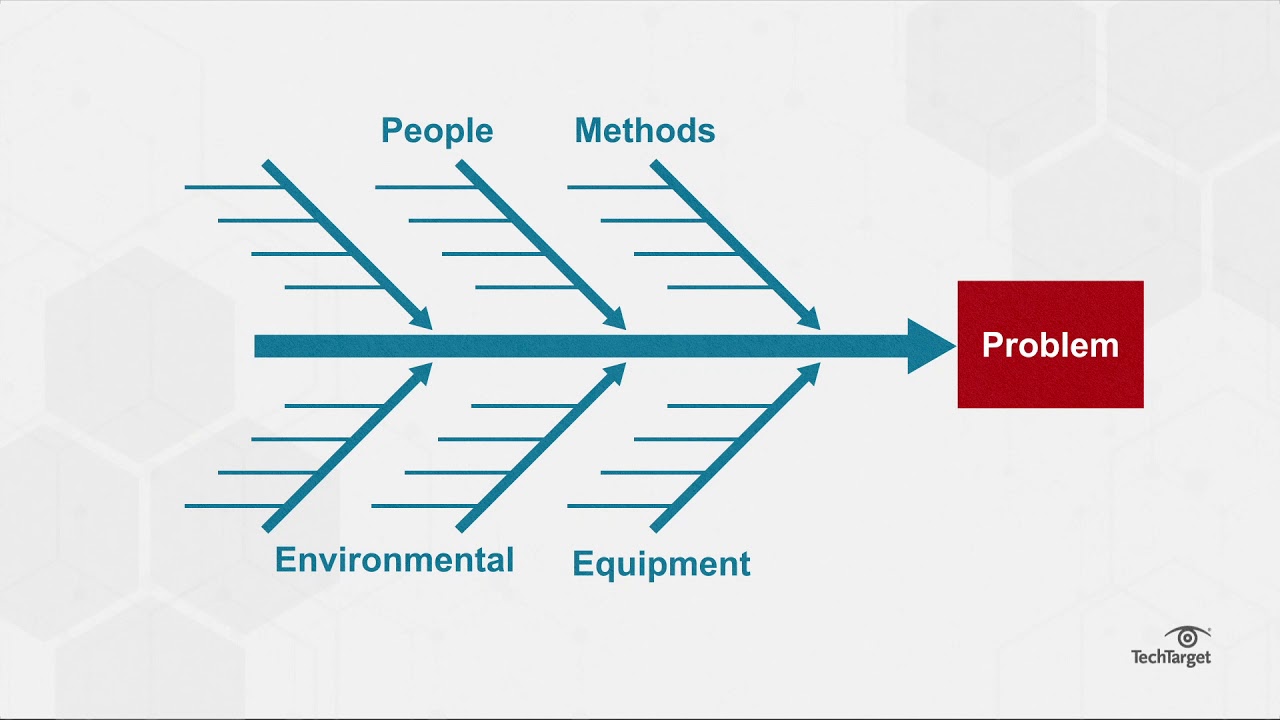
- 🔍 The Ishikawa Diagram, also known as the Fishbone Diagram, is a tool used for identifying, exploring, and displaying the causes and effects of a specific problem or issue.
- 🤝 The process begins by identifying a problem or undesired effect, which is the 'head' of the fishbone, and then brainstorming with a team to find potential causes and solutions.
- 🎯 Start by identifying macro causes using the 6M method (Man, Machine, Material, Method, Measurement, and Environment) to organize brainstorming and discussion.
- 💡 Engage team members who have knowledge about the problem and can contribute to the brainstorming session to ensure productive outcomes.
- 🌟 Encourage open brainstorming to identify micro causes, which are more specific and can lead to actionable changes.
- 🔄 Use the brainstorming session to challenge common misconceptions about root causes and understand that multiple factors may contribute to a problem.
- 📋 Document all ideas and potential causes on the diagram, which helps in visualizing the relationships between different factors and the problem at hand.
- 🛠️ Focus on developing changes or solutions that are practical and directly address the identified micro causes.
- ⏳ Remember that the purpose of the Ishikawa Diagram is to generate actionable changes, not just to discuss or theorize.
- 🔍 Validate the identified causes with data or customer feedback to ensure that the root causes are accurately understood.
- 📈 The Ishikawa Diagram is an effective tool for knowledge sharing and team learning, as it brings together diverse perspectives to solve problems.
Q & A
What is the main purpose of the Ishikawa diagram mentioned in the script?
-The main purpose of the Ishikawa diagram is to identify the root causes of a problem and generate potential solutions through a brainstorming process with a team.
How does the speaker suggest using the digital Ishikawa diagram?
-The speaker suggests using the digital Ishikawa diagram to analyze an undesired effect, organize brainstorming sessions with the team, and identify changes that can be made to address the problem.
What is the first step in creating an Ishikawa diagram according to the speaker?
-The first step is to identify a defect or an undesired effect related to the project, which will be the focus of the analysis.
Who should be involved in the brainstorming sessions for the Ishikawa diagram?
-The speaker recommends involving people within the company who can contribute to understanding why the problem is occurring and who can provide valuable suggestions.
What is the 6 M method mentioned by the speaker?
-The 6 M method refers to identifying macro causes related to the problem, which include Manpower, Method, Machine, Material, Measurement, and Environment.
How does the speaker suggest moving from macro causes to micro causes in the Ishikawa diagram?
-After identifying the macro causes, the speaker suggests asking the team for their opinions on what might be causing the problem in each macro category and then moving to micro causes by discussing specific factors such as driving habits or vehicle maintenance.
What is the importance of validating the causes identified in the Ishikawa diagram?
-Validation of the causes is crucial to ensure that the identified causes are real and not just assumptions. This helps to focus on practical solutions and avoid wasting time on ineffective changes.
How does the speaker emphasize the value of the Ishikawa diagram?
-The speaker emphasizes that the value of the Ishikawa diagram lies not only in its final outcome but also in the process of its creation, which promotes knowledge sharing and learning among the team members.
What is an example of a problem and its potential solutions discussed in the script?
-An example discussed is the high fuel consumption of a car. Potential solutions include driving at a slower speed, checking the oil for efficiency, ensuring proper tire pressure, and maintaining correct calibration.
What is the speaker's advice on selecting participants for the brainstorming session?
-The speaker advises against selecting people who have no knowledge or connection to the problem or process. It's important to include competent individuals who can contribute meaningfully to the discussion and problem-solving.
Why is it important to focus on multiple causes when addressing a problem with the Ishikawa diagram?
-Focusing on multiple causes is important because some problems are complex and may not have a single root cause. Addressing several small causes can lead to the desired effect, as opposed to searching for a single silver bullet solution.
Outlines

This section is available to paid users only. Please upgrade to access this part.
Upgrade NowMindmap

This section is available to paid users only. Please upgrade to access this part.
Upgrade NowKeywords

This section is available to paid users only. Please upgrade to access this part.
Upgrade NowHighlights

This section is available to paid users only. Please upgrade to access this part.
Upgrade NowTranscripts

This section is available to paid users only. Please upgrade to access this part.
Upgrade NowBrowse More Related Video
Ishikawa Vs 5 Why I Root Cause Analysis: Understanding the Difference and Relationship
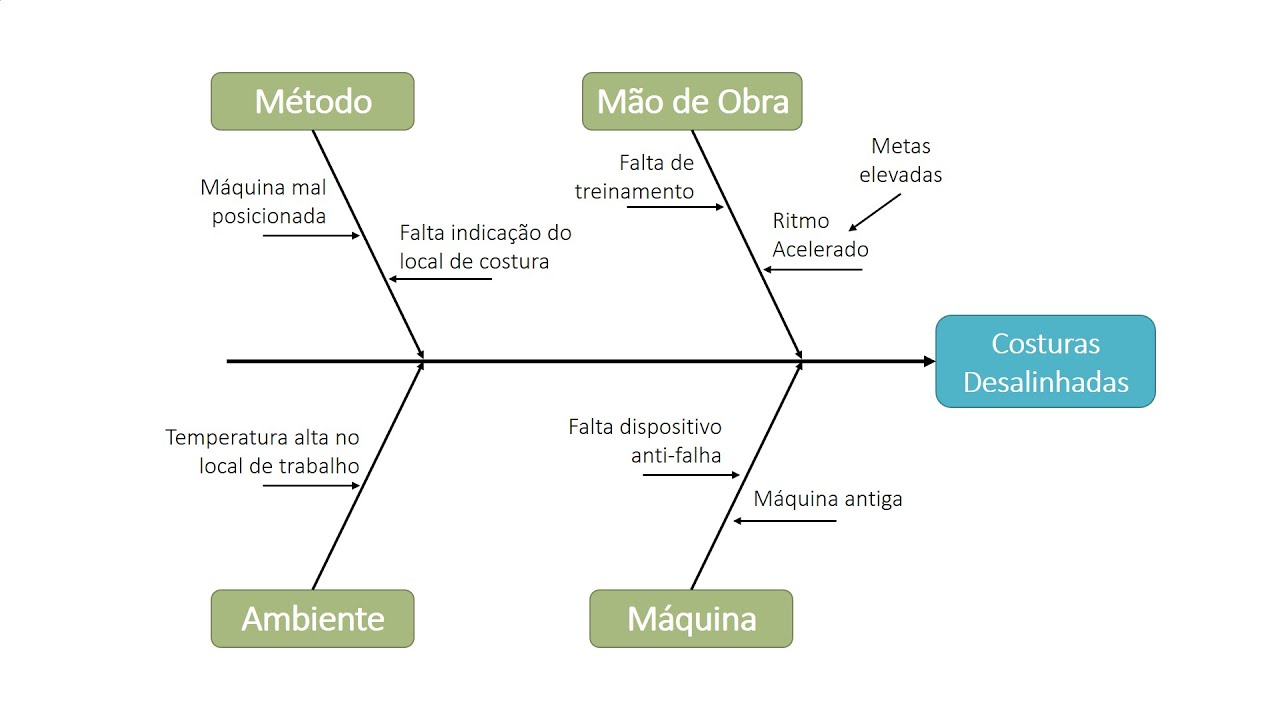
Diagrama de Ishikawa (Ferramenta da Qualidade): Teoria + Exemplo Prático

Title: How to Construct a Fishbone Diagram | Fishbone diagram | Invensis Learning
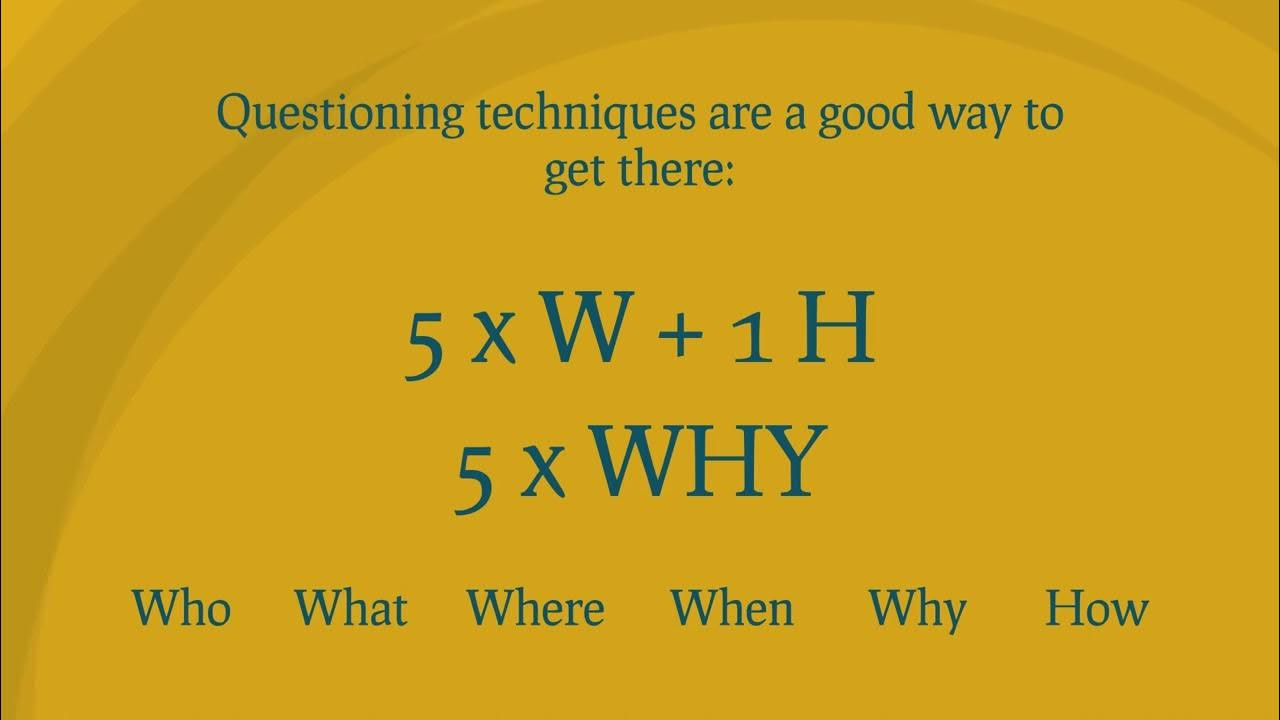
What is 5 x W + 1H?

How to Solve a Problem in Four Steps: The IDEA Model
What is a Fishbone Diagram (Ishikawa Diagram)?
5.0 / 5 (0 votes)