Descriptive Statistics: FULL Tutorial - Mean, Median, Mode, Variance & SD (With Examples)
Summary
TLDRThis video introduces descriptive statistics, a key part of quantitative analysis, by breaking down essential concepts in simple language with examples. Descriptive statistics summarize and describe data sets, using metrics like counts, percentages, and proportions. The video explains measures of central tendency (mean, median, mode) and dispersion (range, variance, standard deviation), helping viewers understand how data is distributed. It also highlights the importance of these statistics in identifying data issues and shaping inferential analysis. By the end, viewers gain clarity on how to interpret their data confidently.
Takeaways
- 😀 Descriptive statistics help summarize and describe essential features of a quantitative dataset, giving a snapshot of its characteristics.
- 📊 Common descriptive statistics include counts, percentages, and proportions, which provide insight into the composition of the data.
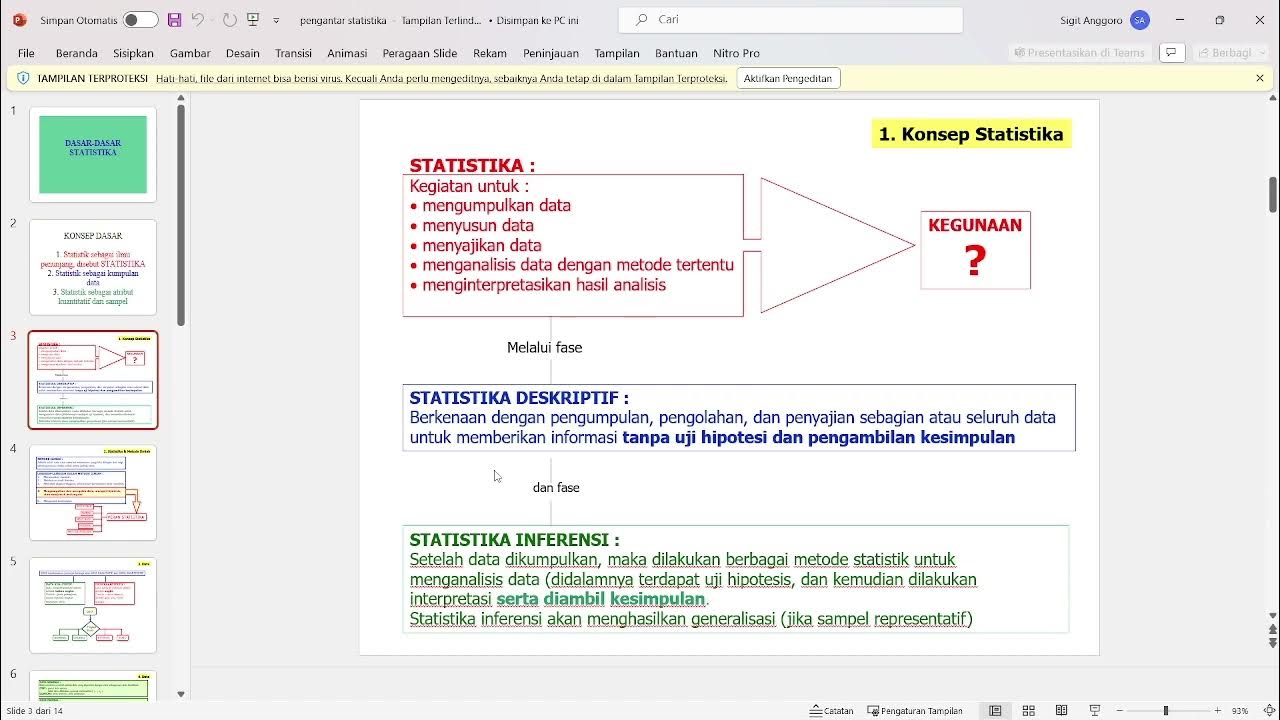
- 🔍 Descriptive stats differ from inferential stats; while descriptive stats summarize the data, inferential stats use sample data to make predictions about a larger population.
- 👁️ Descriptive stats are crucial for identifying potential issues like outliers or missing responses in your dataset.
- 💡 Descriptive statistics inform the decision-making process when using inferential statistics, ensuring that the data is suitably shaped for meaningful results.
- ⚖️ The three main measures of central tendency are the mean (average), median (middle value), and mode (most frequent value), which summarize the central point of a dataset.
- 📉 Measures of dispersion, such as range, variance, and standard deviation, help understand how spread out the data is and provide context for interpreting the mean.
- 🔄 A normal distribution or bell curve is common in datasets, but data can also be skewed, measured by the skewness statistic.
- 🚨 High measures of dispersion indicate that data is more spread out, meaning that the mean may need to be interpreted with caution.
- 📈 Descriptive statistics are essential for understanding the shape, center, and spread of your data before moving to more advanced inferential analysis.
Q & A
What are descriptive statistics?
-Descriptive statistics are a way to summarize and describe the essential features of a quantitative data set, such as survey responses or sales data. They provide a snapshot of the data's characteristics, helping to understand its shape and distribution.
How do descriptive statistics differ from inferential statistics?
-Descriptive statistics describe and summarize the data itself, while inferential statistics use data from a sample to make predictions or inferences about a larger population.
Why are descriptive statistics important in quantitative analysis?
-Descriptive statistics are crucial for identifying potential issues in a data set, such as outliers or missing responses. They also inform the decision-making process when using inferential statistics by providing insight into the shape of the data.
What are the three common measures of central tendency?
-The three common measures of central tendency are the mean (average), the median (middle value in a data set), and the mode (most frequently occurring number).
Can you provide an example of how mean, median, and mode are used?
-In a data set of service ratings from 15 customers, the mean could be the average rating (5.8), the median could be the middle value (6), and the mode could be the most frequent rating (5). These values provide insight into customer sentiment.
What is a normal distribution or bell curve?
-A normal distribution, also known as a bell curve, is a common shape in data analysis where most data points cluster around the center, creating a symmetrical curve. The mean, median, and mode are typically close in value.
What is skewness and how does it affect data interpretation?
-Skewness measures the asymmetry of the data distribution. A data set can lean to the left (negative skew) or right (positive skew), impacting how central tendency measures like mean and median relate to the data's shape.
What are measures of dispersion and why are they important?
-Measures of dispersion, such as range, variance, and standard deviation, show how spread out the data is around the mean. They are essential for understanding the reliability of the mean and the overall shape of the data set.
What is the range, and how does it indicate data dispersion?
-The range is the difference between the largest and smallest numbers in a data set. A high range suggests the data might be spread out, though outliers could affect this measure.
How do variance and standard deviation help measure data spread?
-Variance measures how much each number in the data set varies from the mean, while standard deviation is the square root of the variance. Both provide insight into data spread, with higher values indicating more dispersion.
Outlines

This section is available to paid users only. Please upgrade to access this part.
Upgrade NowMindmap

This section is available to paid users only. Please upgrade to access this part.
Upgrade NowKeywords

This section is available to paid users only. Please upgrade to access this part.
Upgrade NowHighlights

This section is available to paid users only. Please upgrade to access this part.
Upgrade NowTranscripts

This section is available to paid users only. Please upgrade to access this part.
Upgrade NowBrowse More Related Video

Data Management

Statistika Matematika Kelas 12 • Part 1: Pengertian Statistika dan Jenis-Jenis Data

Statisitik ke 3-1

Introduction to Statistics (1.1)

Quantitative Data Analysis 101 Tutorial: Descriptive vs Inferential Statistics (With Examples)

SEJARAH DAN PENGERTIAN STATISTIK - STATISTIK DESKRIPTIF | BAB 1
5.0 / 5 (0 votes)