FRM: Normal probability distribution
Summary
TLDRDavid Harper from the Bionic Turtle offers an insightful tutorial on the normal distribution, a fundamental concept in probability. He explains the distribution's characteristics, including its bell curve shape, symmetry, and the two parameters defining it: mean and standard deviation. Harper also discusses the misuse of the normal distribution in financial asset returns due to their fat-tailed nature and positive skew, contrasting it with the normal distribution's thin tails. He concludes by highlighting the distribution's prevalence due to its simplicity and the central limit theorem.
Takeaways
- 📚 The normal distribution, also known as the bell curve or Gaussian distribution, is the most common and familiar probability distribution.
- 📈 It's often used to describe asset returns, despite being a misuse due to its symmetrical and clean nature compared to the actual fat-tailed distributions of financial returns.
- 📊 The normal distribution is characterized by its symmetry and the presence of two parameters: mean and standard deviation, which fully describe the distribution.
- 📉 The script illustrates the mismatch between the normal distribution and actual stock returns, such as Google's, which are positively skewed and have fatter tails.
- 🔢 The normal distribution's density function is implemented with the formula involving π and e, and parameters for mean and standard deviation.
- 📝 The script demonstrates how to plot the normal distribution using both an Excel function and a manual formula, showing their equivalence.
- 🔧 By adjusting the mean and standard deviation, the script shows how the normal distribution curve shifts without changing its shape, highlighting the distribution's behavior.
- 🌐 The normal distribution is fully described by only two parameters, making it convenient for various applications.
- 📋 The script explains the '68-95-99.7' rule, which describes the proportion of the area under the normal distribution curve within one, two, and three standard deviations from the mean.
- 📘 The normal distribution is continuous, symmetrical, and has a kurtosis of three, indicating no excess kurtosis or fat tails.
- 🌟 The prevalence of the normal distribution is due to its simplicity and the central limit theorem, which states that the sampling mean of samples tends to be normally distributed, emphasizing its importance in statistics rather than in risk management.
Q & A
What is the normal distribution also known as?
-The normal distribution is also known as the normal bell curve and occasionally referred to as a Gaussian distribution.
Why is the normal distribution sometimes misused to describe asset returns?
-The normal distribution is sometimes misused to describe asset returns due to its convenience and elegant properties, despite being inappropriate for financial returns because it does not accurately represent their characteristics.
What does the histogram of Google's stock price daily returns show about the fit of the normal distribution?
-The histogram of Google's stock price daily returns shows that the normal distribution does not fit well, as there is a positive skew and the presence of outlier returns, indicating fat-tailed distributions.
What is meant by the term 'leptokurtosis' in the context of asset returns?
-Leptokurtosis refers to the phenomenon where asset returns have fatter tails than the normal distribution, meaning there is a higher likelihood of extreme values occurring.
What are the two parameters needed for the normal distribution function?
-The two parameters needed for the normal distribution function are the mean and the standard deviation, which determine the peak and the dispersion of the curve, respectively.
What is the standard normal distribution and what are its parameters?
-The standard normal distribution is a specific case of the normal distribution with a mean of zero and a standard deviation of one.
How does changing the mean affect the normal distribution curve?
-Changing the mean shifts the peak of the normal distribution curve along the x-axis without altering the shape of the curve.
How does changing the standard deviation affect the normal distribution curve?
-Changing the standard deviation affects the width of the normal distribution curve, with a larger standard deviation resulting in a wider, more dispersed curve.
What are the 'rules of thumb' regarding the area under the normal distribution curve?
-The rules of thumb state that approximately 68% of the area under the curve is within one standard deviation of the mean, 95.5% within two standard deviations, and 99.7% within three standard deviations.
What are the characteristics of the normal distribution?
-The characteristics of the normal distribution include being continuous, fully described by two parameters (mean and standard deviation), symmetrical with a skew of zero, and having no excess kurtosis (kurtosis of three).
Why is the normal distribution so common in statistics?
-The normal distribution is common due to its simplicity with only two parameters and the central limit theorem, which states that the sampling mean of samples tends to become normally distributed.
Outlines

Этот раздел доступен только подписчикам платных тарифов. Пожалуйста, перейдите на платный тариф для доступа.
Перейти на платный тарифMindmap

Этот раздел доступен только подписчикам платных тарифов. Пожалуйста, перейдите на платный тариф для доступа.
Перейти на платный тарифKeywords

Этот раздел доступен только подписчикам платных тарифов. Пожалуйста, перейдите на платный тариф для доступа.
Перейти на платный тарифHighlights

Этот раздел доступен только подписчикам платных тарифов. Пожалуйста, перейдите на платный тариф для доступа.
Перейти на платный тарифTranscripts

Этот раздел доступен только подписчикам платных тарифов. Пожалуйста, перейдите на платный тариф для доступа.
Перейти на платный тарифПосмотреть больше похожих видео
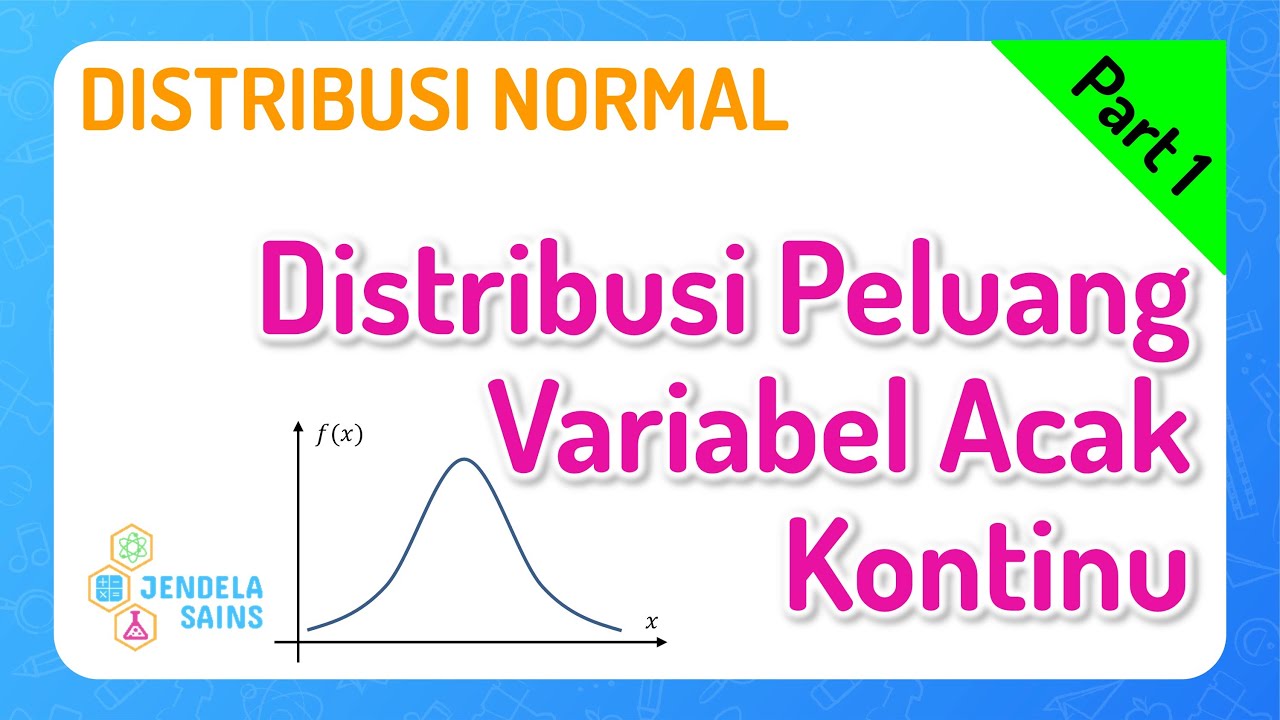
Distribusi Normal • Part 1: Distribusi Peluang Variabel Acak Kontinu
Types Of Distribution In Statistics | Probability Distribution Explained | Statistics | Simplilearn

Metode Statistika | Sebaran Peluang Kontinu | Mengenal Sebaran Normal
Distribusi Probabilitas Normal
Normal Distribution EXPLAINED with Examples

Uso de curva de distribución normal con Geogebra
5.0 / 5 (0 votes)
