Types Of Distribution In Statistics | Probability Distribution Explained | Statistics | Simplilearn
Summary
TLDRThis video tutorial from Simply Learn covers the fundamentals of probability distributions in statistics, focusing on normal, binomial, and Poisson distributions. It explains how normal distribution forms a symmetrical bell curve around the mean, while binomial distribution is used for experiments with two outcomes. Poisson distribution is introduced for modeling the number of events in a fixed interval. The tutorial also touches on concepts like continuous probability density, standard deviation, and z-scores, providing examples to illustrate their applications.
Takeaways
- 📊 A probability distribution lists all possible outcomes of a random variable with their corresponding probability values.
- 📈 Normal distribution is a continuous probability density function that results in a symmetrical bell curve, often found in datasets where values cluster around a central mean.
- 📚 Continuous probability density is used when a random variable can take any value within a range, making it impossible to assign a probability to any single exact value.
- 📉 The probability density function defines the range of values a continuous random variable can take, helping to understand the likelihood of different outcomes.
- 📊 Standard deviation measures the spread or dispersion of data points relative to the mean, with a higher standard deviation indicating a greater spread.
- 📊 The standard normal distribution is a specific type of normal distribution with a mean of zero and a standard deviation of one, simplifying comparisons across different datasets.
- 🔢 The z-score indicates how many standard deviations an element is from the mean, useful for comparing data points across different distributions.
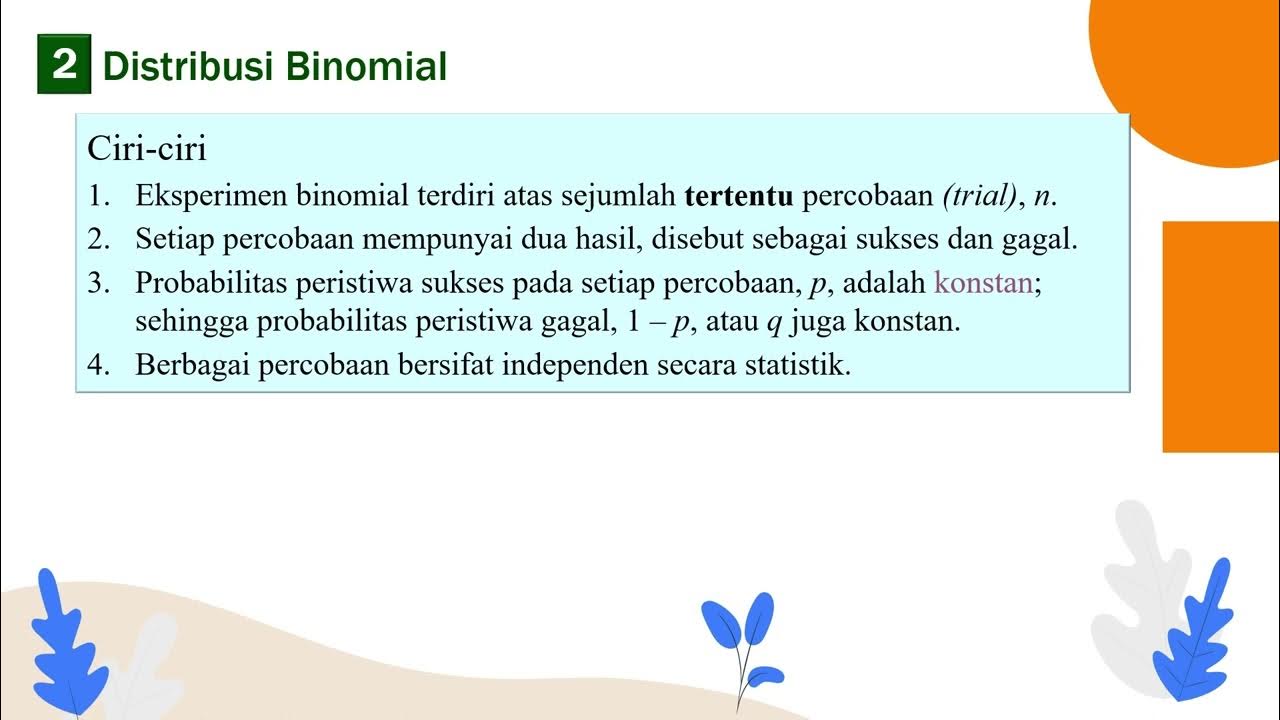
- 🎰 Binomial distribution is used to calculate the probability of a certain number of successes in a fixed number of independent trials with the same success probability.
- 🚫 Poisson distribution models the number of events happening in a fixed interval of time or space, especially useful when the probability of event occurrence is low.
- 📖 Random variables are numerical representations of outcomes in statistical experiments, classified as discrete or continuous depending on the nature of the values they can assume.
Please replace the link and try again.
Outlines

This section is available to paid users only. Please upgrade to access this part.
Upgrade NowMindmap

This section is available to paid users only. Please upgrade to access this part.
Upgrade NowKeywords

This section is available to paid users only. Please upgrade to access this part.
Upgrade NowHighlights

This section is available to paid users only. Please upgrade to access this part.
Upgrade NowTranscripts

This section is available to paid users only. Please upgrade to access this part.
Upgrade NowBrowse More Related Video

[Statistika]: Macam-Macam Distribusi Probabilitas (Binomial, Poisson, Normal dan Student-T)

Modul 1.1 - MATERI MODUL 1 DISTRIBUSI PELUANG
Sesi 5 3 Distribusi Probabilitas Bagian 3

Metode Statistika | Sebaran Peluang Diskrit | Bernoulli | Binomial | Poisson

Probability: Types of Distributions
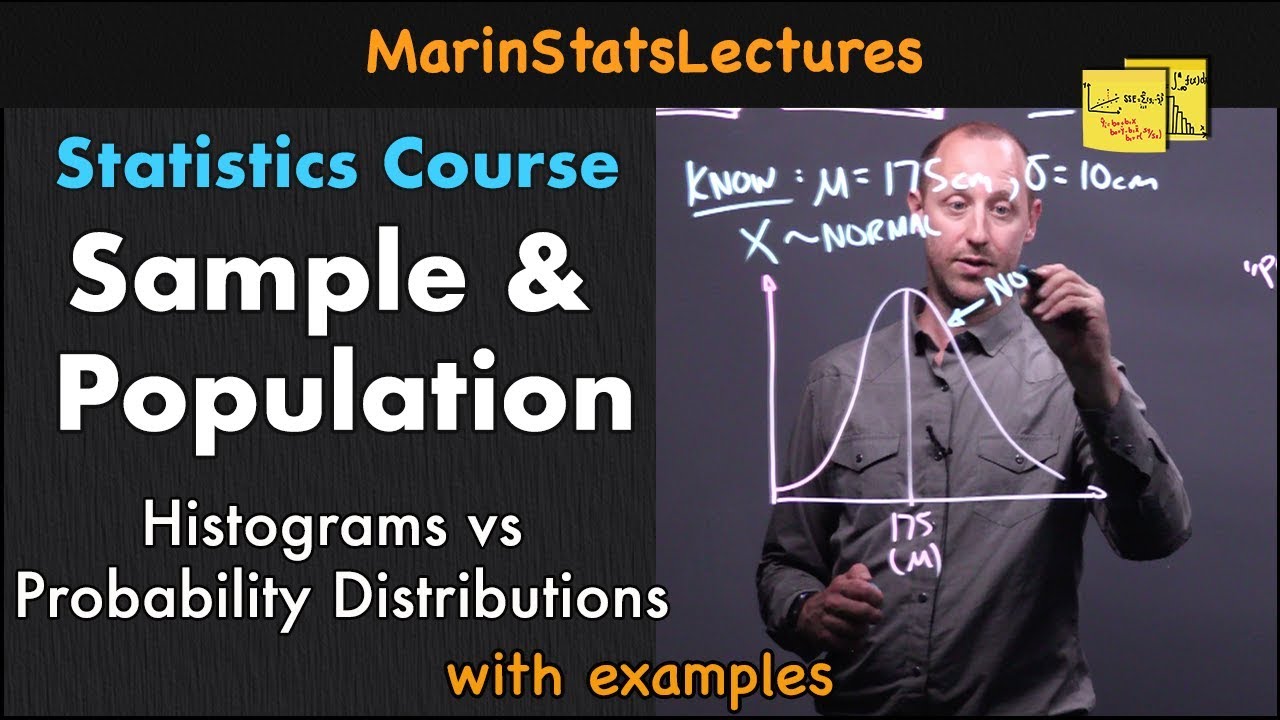
Sample and Population in Statistics | Statistics Tutorial | MarinStatsLectures
5.0 / 5 (0 votes)