NVDA Stock - Perfect Rejection At Key Level
Summary
TLDRIn this Nvidia daily update, the presenter breaks down the stock's recent price action, technical structure, and market context. Nvidia is currently showing signs of a bearish trend with lower highs and lower lows, raising concerns of a potential dead cat bounce. Key resistance levels are $180–181 and all-time highs around $184, while critical support lies at $169–170. The broader semiconductor sector shows mixed performance, and upcoming events like the rate cut decision and triple witching could drive volatility. Despite bullish options flow and overall market strength, careful monitoring of these levels is essential for short-term trading decisions.
Takeaways
- 📉 Nvidia is down ~0.1% today, closing around $177, underperforming the broader market.
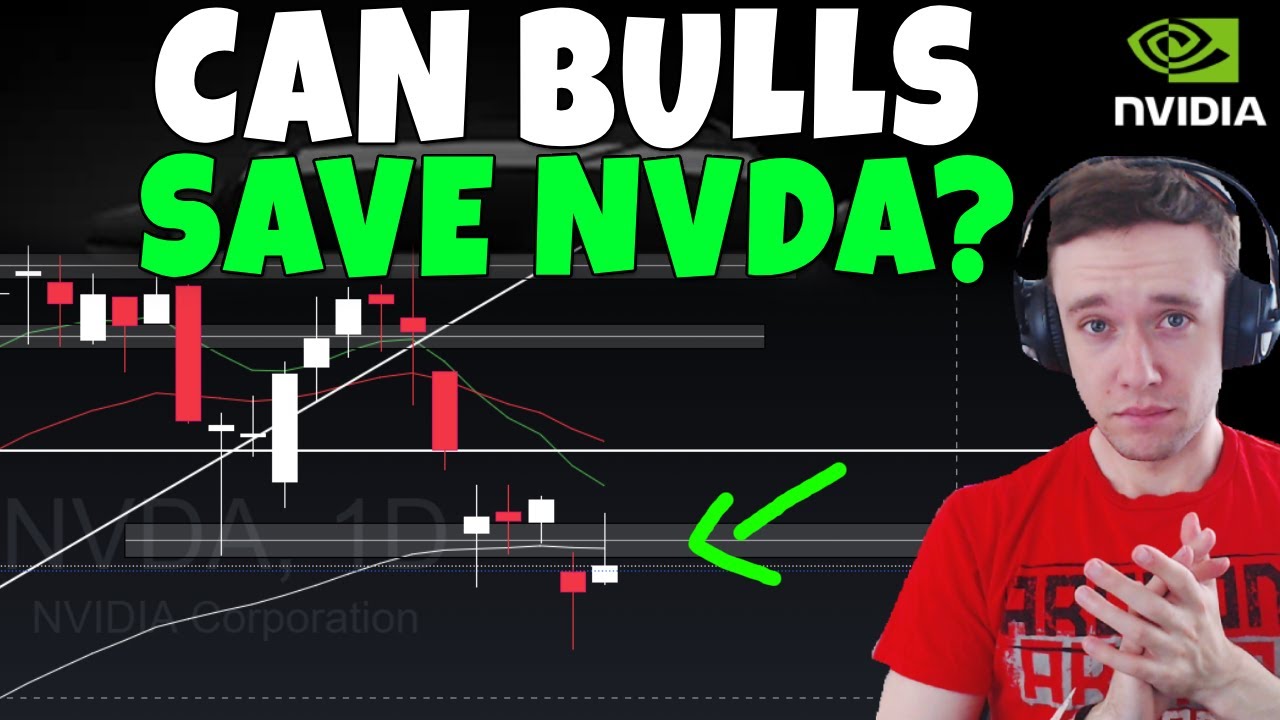
- 🔻 The stock appears to be in a bearish structure with a series of lower highs and lower lows, raising concerns of a dead cat bounce or bull trap.
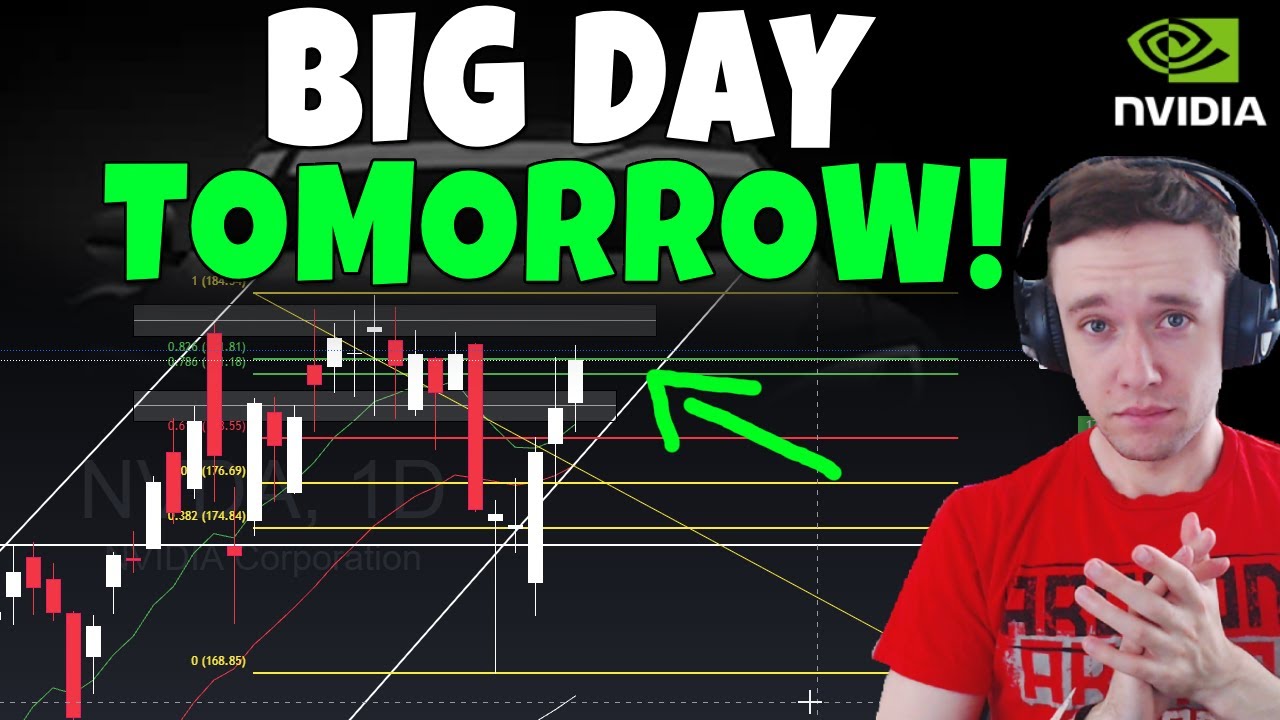
- 📈 Key bullish levels to watch: $180–181 (green Fibonacci) and all-time highs (~$184); holding above these levels is necessary for bullish momentum.
- 🛑 Key bearish support levels: minor at $174–172, major at $169–170; losing $169–170 would signal a very bearish scenario.
- 💹 Options flow shows $16M bullish vs $5M bearish, but end-of-day selling indicates cautious bulls and emerging bear pressure.
- 💻 In the semiconductor sector, MU and AVGO are performing strongly, while Nvidia and AMD are showing weaker moves.
- 📊 The Q's are bullish above 575, with mid/low 580s being ideal for continued market strength.
- ⚠️ Market shows potential bearish divergences (RSI and MACD declining) despite overall bullish momentum.
- 📅 Upcoming events next week include a rate cut decision and triple witching, which could increase volatility.
- 📝 Traders should monitor Nvidia closely day by day, focusing on resistance at $180–181 and support at $169–170 to gauge market direction.
Q & A
What is the main purpose of the video?
-The video provides a daily update on Nvidia, including recent performance, technical analysis, market trends, options flow, and upcoming events that may affect the stock.
Does the creator provide financial advice in the video?
-No, the creator explicitly states that the content is not financial advice and is intended for informational and educational purposes.
What are the membership tiers mentioned, and what do they offer?
-There are three membership tiers: $3/month for Tesla updates and technical analysis, $5/month for Nvidia updates in addition, and $7/month for broader market updates including non-Tesla, non-Nvidia stocks.
How did Nvidia perform recently according to the video?
-Nvidia was down about 0.1% for the day, closing around $177, which is slightly underperforming compared to the broader market.
What is meant by the term 'dead cat bounce' in the context of Nvidia?
-A 'dead cat bounce' refers to a temporary recovery in a stock price after a decline, which may not indicate a true reversal of a bearish trend. The video suggests Nvidia's recent uptick could be such a bounce.
What are the key bullish levels Nvidia needs to surpass?
-Bulls need to surpass and hold above $180–$181 (green Fibonacci level) and ultimately break all-time highs to regain bullish momentum.
What are the main support levels for Nvidia mentioned in the video?
-Key support levels are $174 (EMA region), $172 (minor support), and $169–$170 (strong support). Breaching these could give bears control.
How does Nvidia's performance compare to other semiconductor stocks?
-MU and AVGO are performing strongly and propping up the semiconductor sector, while AMD and Nvidia are showing weaker moves.
What does the options flow indicate about market sentiment for Nvidia?
-There was $16 million in confirmed bullish flow and $5 million in confirmed bearish flow, indicating early bullish sentiment that weakened slightly by the end of the day.
What upcoming events could impact Nvidia and the broader market?
-The upcoming rate cut decision and triple witching week could introduce volatility in Nvidia and the broader market next week.
What is the overall market sentiment according to the video?
-The broader market, particularly the Q's index, is still bullish above 575, although there are some bearish divergences in RSI and MACD that warrant caution.
What indicators are mentioned that suggest Nvidia's trend is still technically bullish despite concerns?
-EMAs are still technically overall bullish, and stochastic indicators suggest some bullish momentum remains, but the overall price structure is concerning due to lower lows and potential lower highs.
Outlines

Этот раздел доступен только подписчикам платных тарифов. Пожалуйста, перейдите на платный тариф для доступа.
Перейти на платный тарифMindmap

Этот раздел доступен только подписчикам платных тарифов. Пожалуйста, перейдите на платный тариф для доступа.
Перейти на платный тарифKeywords

Этот раздел доступен только подписчикам платных тарифов. Пожалуйста, перейдите на платный тариф для доступа.
Перейти на платный тарифHighlights

Этот раздел доступен только подписчикам платных тарифов. Пожалуйста, перейдите на платный тариф для доступа.
Перейти на платный тарифTranscripts

Этот раздел доступен только подписчикам платных тарифов. Пожалуйста, перейдите на платный тариф для доступа.
Перейти на платный тарифПосмотреть больше похожих видео


5.0 / 5 (0 votes)
