Can NVIDIA Bottom Here? - NVDA Stock, SPY, QQQ Update
Summary
TLDRIn this Nvidia daily update, the host reviews the stock's recent performance, noting it closed flat at around $170.6, underperforming the broader market. Short-term momentum has slowed, with stabilization expected near 169–171, while reclaiming 174–175 is key for bullish setups. Technical indicators like the 9 EMA and MACD suggest a potential consolidation before the next move. Broader market trends, including QQQ and SPY divergences, signal caution. Options flow shows modest bullish activity, hinting at possible short-term bounces. Overall, the host emphasizes monitoring price action day by day to determine whether Nvidia and the market will resume upward momentum or continue consolidating.
Takeaways
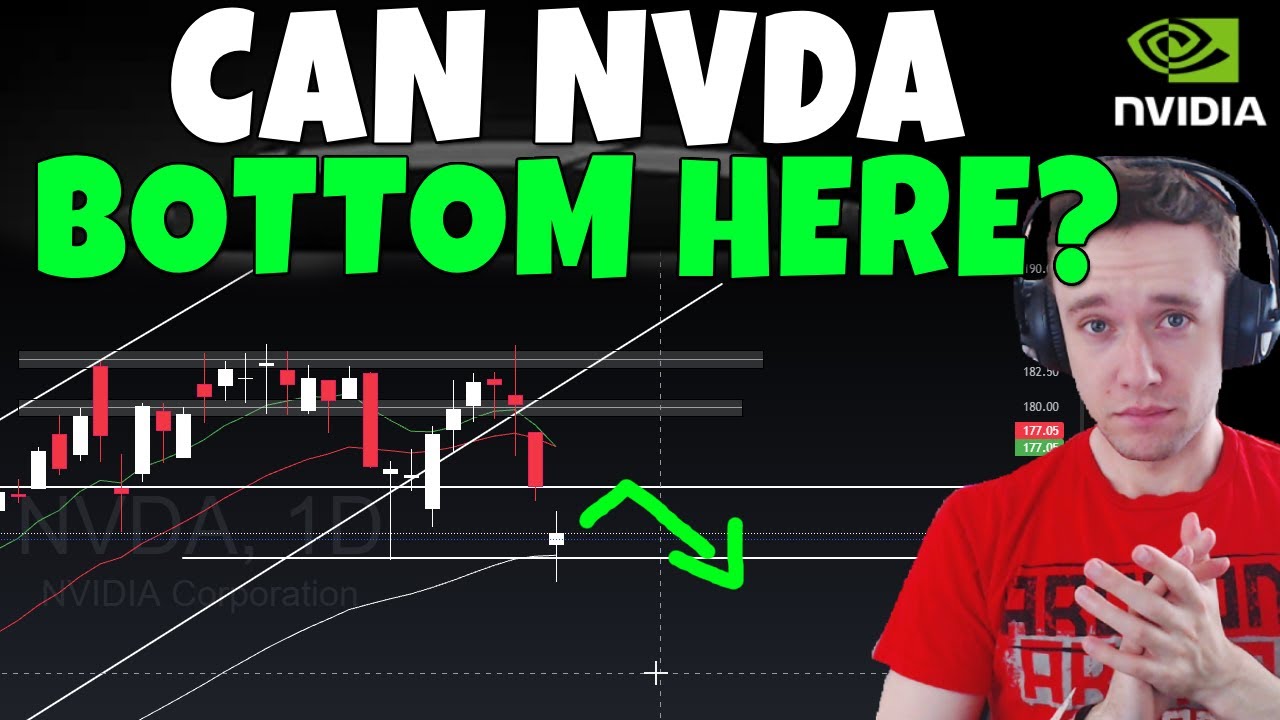
- 📉 Nvidia closed nearly flat at $170.6, underperforming the broader market like QQQ which is up 8%.
- ⚡ Nvidia has lost short-term momentum but could regain it if key levels are recaptured.
- 📊 Key support level: $169 – daily closes below this may indicate further downside risk.
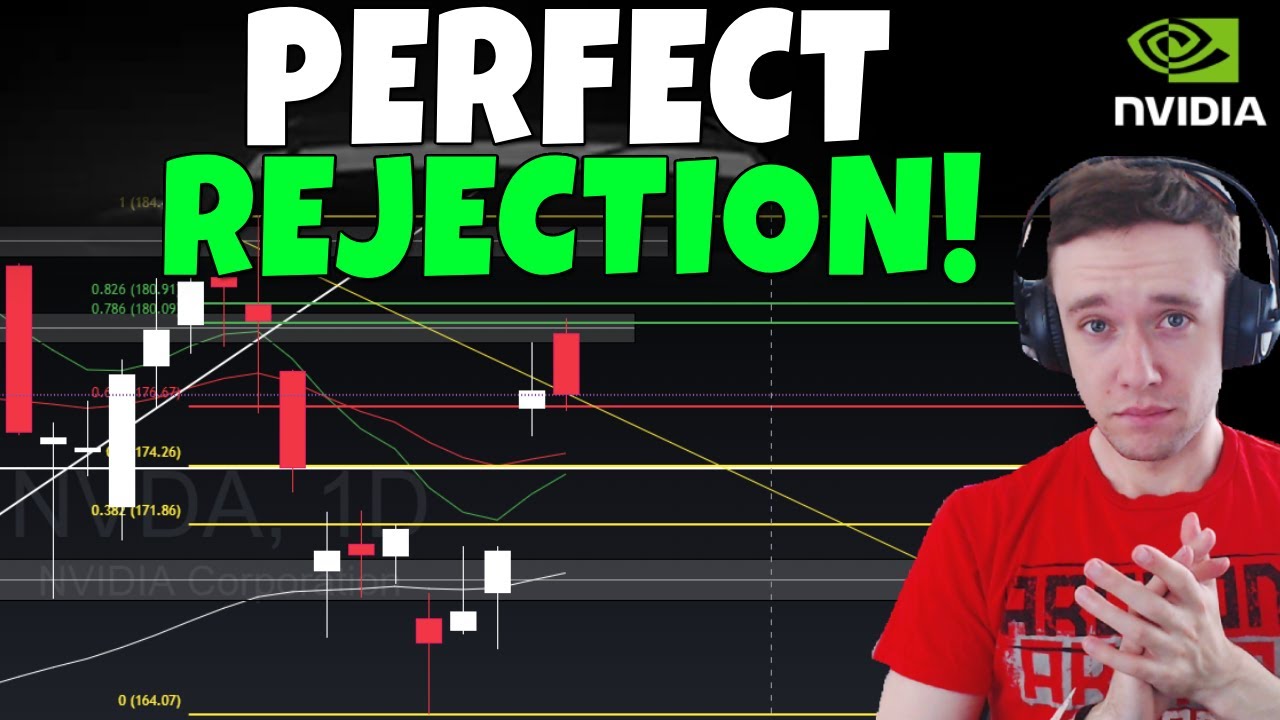
- 📈 Key resistance/bullish target: $174-$175 – holding above this range is necessary for bullish momentum.
- 🟢 Longer-term potential entry point: ~$150, retesting previous all-time highs with Fibonacci alignment.
- 📉 MACD is cooling off after being elevated, suggesting possible further consolidation before the next move.
- 📅 Weekly chart shows Nvidia holding around 9 EMA, caution advised until strength is confirmed above $174-$175.
- 📌 Broader market influence: Nvidia closely follows QQQ; bearish signals in QQQ could impact Nvidia’s trend.
- 🔮 QQQ shows a potential bearish head and shoulders pattern with critical levels at 575 (bullish) and 560 (bearish risk).
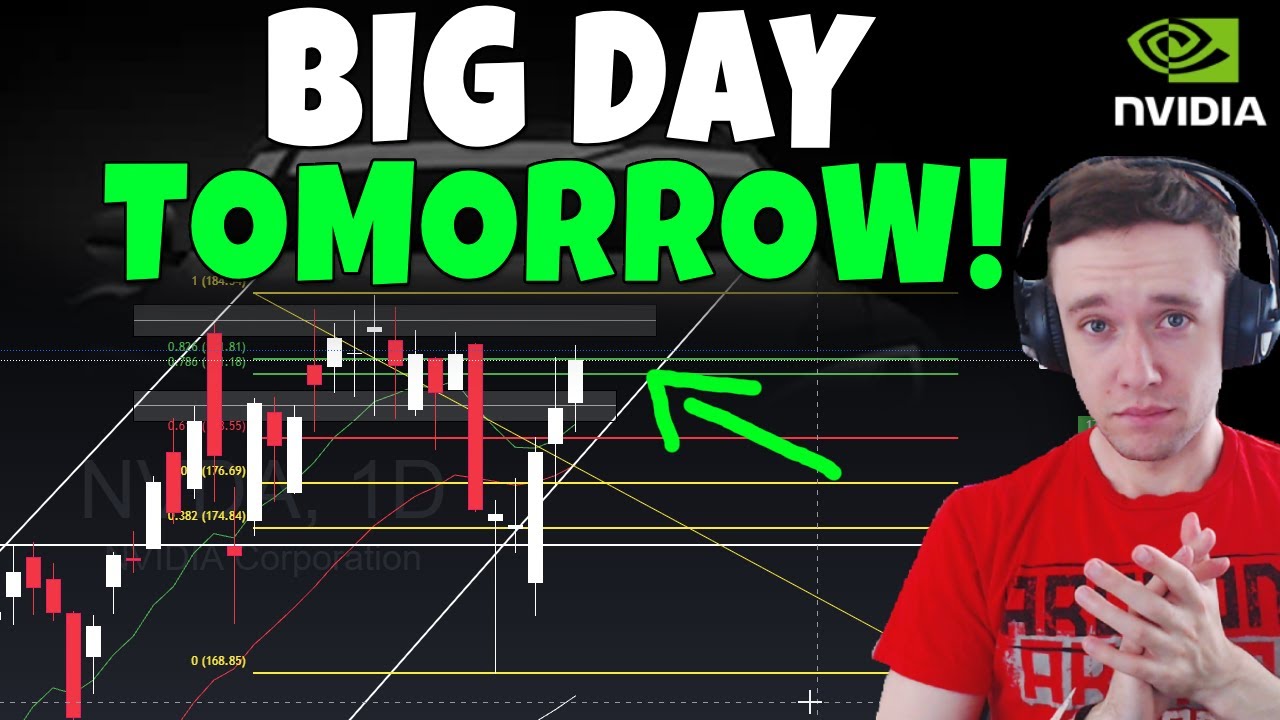
- 💹 Options flow indicates moderately bullish activity, including a notable $175 call for Friday expiration, supporting potential stabilization.
- 🛑 Short-term outlook: Nvidia may remain range-bound near $170-$171 with minor bounces before direction is clarified.
- 🌟 Overall, a decisive move above $174-$175 signals bullish continuation, while dropping below $169 increases downside risk.
Q & A
What was Nvidia's closing price in the latest update?
-Nvidia closed roughly flat at $170.6, down approximately 0.1% for the day.
How has Nvidia's recent performance compared to the broader market?
-Nvidia has underperformed compared to QQQ, which was up around 8%, indicating a loss of momentum relative to the broader market.
What short-term bounce level does the analyst suggest for Nvidia?
-The analyst expects a potential short-term bounce to around $174, assuming stabilization continues.
Which key levels indicate a bullish outlook for Nvidia?
-A bullish outlook would be considered if Nvidia reclaims and holds above $174–$175, with daily closes above these levels signaling potential upward momentum.
Which levels indicate potential bearish risk for Nvidia?
-A daily close below $169, which is also below the 50 EMA, would be a key bearish signal indicating potential further downside.
What is the analyst's long-term target area for Nvidia retracement?
-The analyst finds Nvidia more exciting for long-term positions if it retraces to previous all-time highs around $150, which aligns with key Fibonacci levels.
What is the current technical state of Nvidia's momentum indicators?
-Momentum indicators such as MACD are cooling off, and the SMI is curling down, showing that bullish momentum has slowed and stabilization is occurring.
How does the broader market context, specifically QQQ and SPY, affect Nvidia?
-QQQ is showing a potential bearish head and shoulders pattern, with SPY making a higher high while QQQ made a lower high, indicating a bearish divergence. This suggests Nvidia could experience similar retracement patterns as the broader market.
What critical levels in QQQ should traders watch according to the analyst?
-Critical levels for QQQ are 575 for bullish confirmation and 560 for bearish risk. Closing above 575 signals faster-than-expected bullish momentum, while closing below 560 could indicate further downside.
What recent Nvidia options activity was observed and what does it imply?
-A 200k call option at a $175 strike for Friday expiration was noted, suggesting decently bullish sentiment and potential stabilization or minor bounce toward $174.
Why does the analyst suggest patience before entering aggressive long positions?
-Because Nvidia has had an aggressive rally and momentum is cooling, the analyst prefers waiting for key retracement levels or stronger confirmation above resistance before entering higher-risk long trades.
How does the analyst summarize Nvidia's current market state?
-Nvidia is currently neutral to slightly bearish, with potential for stabilization or a short-term bounce, but confirmation of a bullish reversal requires reclaiming $174–$175. Key support is $169, and retracement to $150 could provide more favorable long-term trading opportunities.
Outlines

This section is available to paid users only. Please upgrade to access this part.
Upgrade NowMindmap

This section is available to paid users only. Please upgrade to access this part.
Upgrade NowKeywords

This section is available to paid users only. Please upgrade to access this part.
Upgrade NowHighlights

This section is available to paid users only. Please upgrade to access this part.
Upgrade NowTranscripts

This section is available to paid users only. Please upgrade to access this part.
Upgrade NowBrowse More Related Video


5.0 / 5 (0 votes)