Can Bulls Still Save NVIDIA?? - NVDA Stock, SPY, QQQ Update
Summary
TLDRIn this Nvidia daily update, the host breaks down the stock's technical performance, highlighting key levels, momentum indicators, and potential bullish or bearish scenarios. Nvidia closed at $168.31, struggling around the crucial $170 support, with EMAs and MACD signaling weak momentum. While bulls are attempting to reclaim ground, further downside to the low $160s or $150–148 Fibonacci levels is possible. The broader market shows mixed signals, with QQQ and SPY above key supports but exhibiting bearish divergences. Options flow remains bullish, indicating buyers are stepping in, yet the stock needs to prove strength to sustain upward momentum.
Takeaways
- 😀 Nvidia closed up ~0.75% at $168.31, reflecting a similar performance to the broader market.
- 📉 Nvidia remains weak overall, with momentum indicators pointing towards a bearish trend, but not fully confirming it yet.
- 🔑 The critical support/resistance level for Nvidia is $170. Bulls need to reclaim this level for potential upside.
- 📊 Momentum indicators (EMAs, MACD) are showing bearish pressure, but the bulls still have time to reclaim control before a full bearish crossover.
- ⚡ A break above $174 could signal a bullish trend, possibly forming a bullish head-and-shoulders pattern or a wedge breakout.
- 📉 Downside levels to watch are mid-$160s and a Fibonacci support level around $150 on the weekly chart, which would be considered a bullish retracement.
- 🔴 Supertrend recently turned bearish, signaling caution for Nvidia's short-term direction.
- 📉 The MACD and RSI indicators on Nvidia are showing bearish divergences, suggesting the possibility of further downside or sideways consolidation.
- 💼 Despite the bearish signs, bulls are still active, with $43M in bullish options flow vs $10M in bearish flow.
- 📈 Broader market outlook remains bullish as long as QQQ stays above 575. A loss of this level would indicate weakening bullish momentum.
Q & A
What was Nvidia's closing price in the latest update?
-Nvidia closed at $168.31, up approximately 0.75% for the day.
What is the significance of the $170 level for Nvidia?
-The $170 level is a key resistance point. If Nvidia closes and holds above it, it could signal a return of bullish momentum. Failing to reclaim it increases the likelihood of further downside.
What momentum indicators were mentioned, and what do they suggest?
-The EMA (9/21/50), MACD, stochastic, and supertrend were mentioned. Currently, they signal fading bullish momentum or bearish conditions, suggesting that Nvidia needs to reclaim key levels to avoid further declines.
What are the next potential support levels if Nvidia continues downward?
-Immediate support is in the $159–$160 range, followed by major support at the weekly Fibonacci 38.2% level around $150, possibly high $140s.
What is meant by a 'bullish retracement' in Nvidia's context?
-A bullish retracement refers to a temporary pullback in price within a larger uptrend. Even if Nvidia drops toward $135–$150, it could still be part of a healthy trend if previous higher lows hold.
How does the broader market (QQQ/S&P 500) affect Nvidia's outlook?
-The broader market is mostly bullish, with QQQ showing support at 575 and 560. A loss of these levels could hinder Nvidia's bullish momentum, while market strength could support potential rebounds.
What bearish divergences are present in the broader market?
-MACD and RSI are showing lower highs while the market itself makes higher highs, indicating a bearish divergence that could lead to sideways consolidation or future downside risk.
What does the options flow indicate about market sentiment on Nvidia?
-Options flow shows strong bullish activity, with $43 million in bullish flow versus $10 million bearish. This suggests that traders are still buying dips and expecting a potential rebound.
What patterns could indicate a bullish scenario for Nvidia?
-A potential wedge breakout or a bullish head-and-shoulders pattern could form if Nvidia reclaims $170 and moves above $174, indicating possible upward momentum.
What are the key levels to watch for a bearish scenario in Nvidia?
-If Nvidia fails to reclaim $170 and EMAs cross bearish, the stock could drop toward $159–$160 first, with the weekly Fibonacci around $150 as the major downside target.
How could upcoming economic events affect Nvidia's outlook?
-Events like the CPI report on Thursday could impact market sentiment and Nvidia's price action, potentially accelerating bullish or bearish momentum depending on results.
Why is reclaiming $170 considered urgent for bulls?
-Bulls need to reclaim $170 before the EMA 9/21 crosses below the 50 EMA. If this crossover happens, it would signal stronger bearish momentum and reduce the likelihood of a short-term bullish rebound.
Outlines

This section is available to paid users only. Please upgrade to access this part.
Upgrade NowMindmap

This section is available to paid users only. Please upgrade to access this part.
Upgrade NowKeywords

This section is available to paid users only. Please upgrade to access this part.
Upgrade NowHighlights

This section is available to paid users only. Please upgrade to access this part.
Upgrade NowTranscripts

This section is available to paid users only. Please upgrade to access this part.
Upgrade Now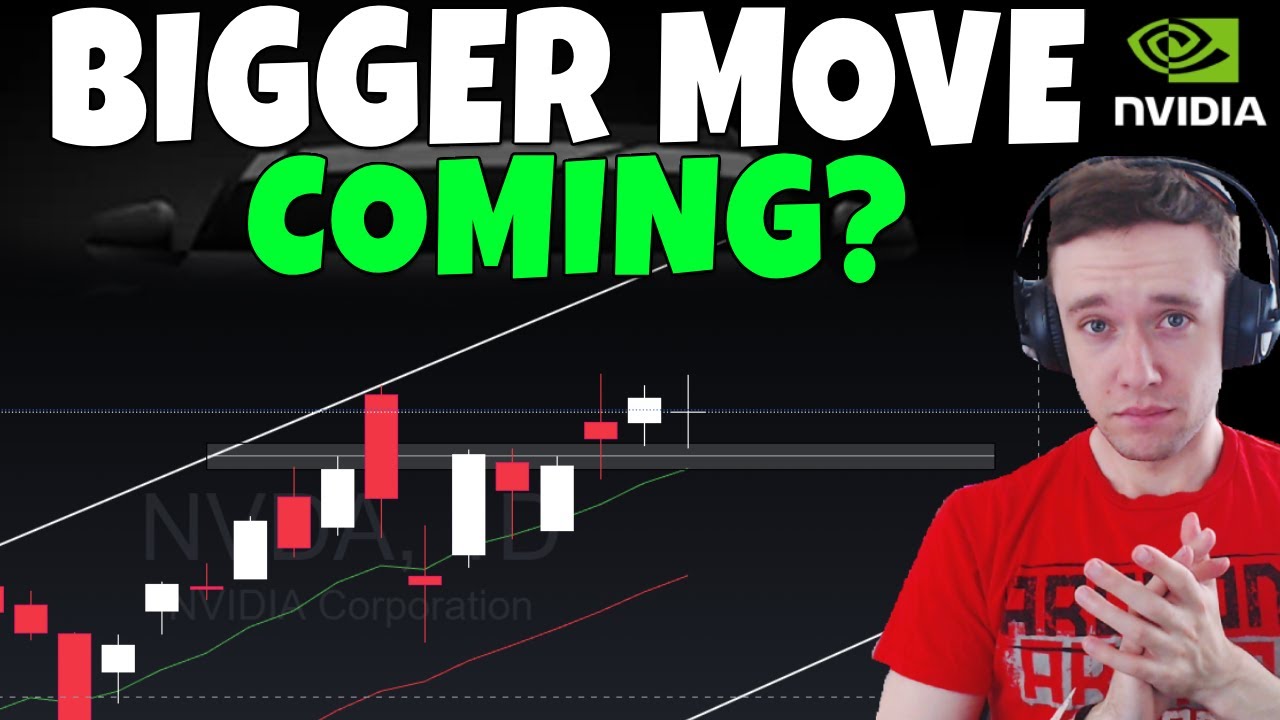


5.0 / 5 (0 votes)