Common Statistical Tools: Preliminary Concepts
Summary
TLDRThis video explains common statistical tools used in hypothesis testing, focusing on the comparison of groups and testing relationships between variables. It covers various types of data (nominal, ordinal, ratio, interval) and outlines both parametric and non-parametric tests like Z-tests, t-tests, ANOVA, Mann-Whitney U, and Kruskal-Wallis tests. Examples are provided for each tool, highlighting their use in educational and clinical research. The video also explains when to use specific statistical methods based on the data type, the purpose of the test, and the number of groups being analyzed.
Takeaways
- 😀 Statistical tests help determine the purpose of research, such as comparing means or testing relationships.
- 😀 Comparison of groups focuses on determining whether the performance of one group differs from another (e.g., Section A vs Section B).
- 😀 Testing relationships involves examining the correlation between variables (e.g., shoe size and IQ).
- 😀 Data can be classified into four types: nominal, ordinal, ratio, and interval, each with specific characteristics for measurement.
- 😀 Nominal data focuses on classification without numerical value (e.g., religious affiliation), while ordinal data includes rankings (e.g., educational attainment).
- 😀 Ratio data involves absolute values with meaningful zero points (e.g., height), while interval data lacks a meaningful zero (e.g., test scores).
- 😀 The difference between independent and dependent samples: independent samples are from different groups, while dependent samples are from the same group measured at different times.
- 😀 Statistical tools like Z-tests, t-tests, and ANOVA are used to compare groups, depending on data type (parametric vs nonparametric).
- 😀 Z-tests are used for comparing two independent sample means when the sample size is large (30 or more).
- 😀 The t-test for independent means is used in experimental research with smaller sample sizes (less than 30), while ANOVA (F-test) compares means across three or more groups.
- 😀 Nonparametric tests such as the Mann-Whitney U test and Kruskal-Wallis test are used when data is ordinal, whereas parametric tests are used for ratio and interval data.
- 😀 The Wilcoxon Signed-Rank test is a nonparametric test for dependent samples, used to compare before-and-after data in the same group (e.g., before and after treatment).
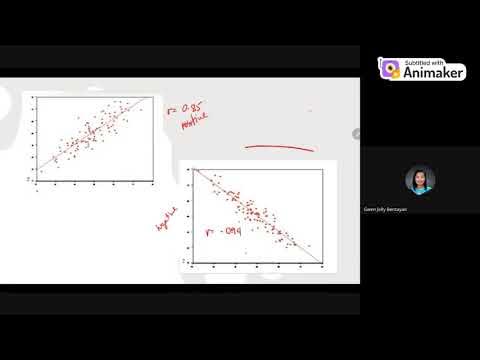
- 😀 Testing relationships between variables can be done using correlation tests such as Pearson's correlation for ratio/interval data and Spearman's rank for ordinal data.
- 😀 Chi-square tests are used to assess relationships between nominal variables (e.g., gender and academic performance), with Cramer's V used to determine the strength of the relationship.
Q & A
What is the primary purpose of statistical tests in hypothesis testing?
-The primary purpose of statistical tests is to compare groups or test relationships between variables. For example, comparing the performance of Section A versus Section B, or testing if IQ is related to shoe size.
What are the four classifications of data based on the measurement scale?
-The four classifications of data are nominal, ordinal, ratio, and interval. Each type corresponds to different methods of measurement and analysis.
What is nominal data, and can you provide an example?
-Nominal data refers to categories without any inherent order or ranking. An example would be religious affiliation, where the values are categories (e.g., Christianity, Islam) with no numerical meaning.
How does ordinal data differ from nominal data?
-Ordinal data involves categories that have a meaningful order or ranking, but the differences between ranks are not necessarily equal. An example is educational attainment (e.g., high school, college, graduate level).
What is the distinction between ratio data and interval data?
-Ratio data has a true zero point, allowing for meaningful ratios (e.g., height or weight), while interval data lacks a true zero, meaning that the zero point is arbitrary (e.g., temperature in Celsius).
What are independent and dependent samples in statistical tests?
-Independent samples refer to two or more groups where the data is collected from separate and unrelated groups. Dependent samples refer to data collected from the same group at different times, such as pre- and post-test results from the same group.
What statistical tools are used for comparing groups in hypothesis testing?
-Common statistical tools for comparing groups include the Z-test, t-test for independent means, and analysis of variance (ANOVA). These tools are used depending on the type of data (ratio, interval, etc.) and the number of groups involved.
When should the Z-test for two sample means be used?
-The Z-test for two sample means is used when comparing the means of two independent groups with a sample size of 30 or more, particularly when dealing with large sample sizes in descriptive research.
What is the purpose of the t-test for independent means?
-The t-test for independent means is used to compare the means of two independent groups, typically in experimental research, where the sample size is less than 30. It helps assess whether there is a significant difference between the two groups.
What is the role of the Kruskal-Wallis test in hypothesis testing?
-The Kruskal-Wallis test is a nonparametric test used to compare three or more independent groups based on ordinal data. It is used when the assumptions of ANOVA (such as normal distribution) are not met.
What statistical test is used to test relationships between variables?
-To test relationships between variables, Pearson’s correlation (for ratio/interval data) and Spearman’s rank correlation (for ordinal data) are commonly used. The chi-square test is used for nominal data to assess the relationship between categorical variables.
How does the Spearman rank-order correlation differ from Pearson's correlation?
-The Spearman rank-order correlation is used for ordinal data to assess the strength of the relationship between ranked variables, while Pearson's correlation is used for interval or ratio data to assess the linear relationship between continuous variables.
What is the significance of using Cramér's V after a chi-square test?
-Cramér's V is used after a chi-square test to determine the strength of the relationship between two categorical variables. It quantifies the degree of association, helping to assess the strength of the correlation.
What is the Wilcoxon signed-rank test, and when is it used?
-The Wilcoxon signed-rank test is a nonparametric test used to compare paired or dependent samples. It is used when the data is ordinal and when comparing before-and-after measurements, such as the effectiveness of a treatment.
What is the role of nonparametric tests in hypothesis testing?
-Nonparametric tests, such as the Mann-Whitney U test or Kruskal-Wallis test, are used when the data does not meet the assumptions of parametric tests (like normal distribution). These tests are suitable for ordinal data and smaller sample sizes.
What is the key difference between parametric and nonparametric tests?
-Parametric tests assume that the data follows a certain distribution (usually normal) and are used with interval or ratio data. Nonparametric tests do not assume a specific distribution and are often used with ordinal data or when sample sizes are small.
Outlines

Этот раздел доступен только подписчикам платных тарифов. Пожалуйста, перейдите на платный тариф для доступа.
Перейти на платный тарифMindmap

Этот раздел доступен только подписчикам платных тарифов. Пожалуйста, перейдите на платный тариф для доступа.
Перейти на платный тарифKeywords

Этот раздел доступен только подписчикам платных тарифов. Пожалуйста, перейдите на платный тариф для доступа.
Перейти на платный тарифHighlights

Этот раздел доступен только подписчикам платных тарифов. Пожалуйста, перейдите на платный тариф для доступа.
Перейти на платный тарифTranscripts

Этот раздел доступен только подписчикам платных тарифов. Пожалуйста, перейдите на платный тариф для доступа.
Перейти на платный тарифПосмотреть больше похожих видео
Educ 307 Test of Significant Difference and Relationship
Uji Hipotesis: Lemma Neyman - Pearson (Kuasa Uji)
Masih berpikir bahwa hipotesis statistik itu membingungkan? | Statistika
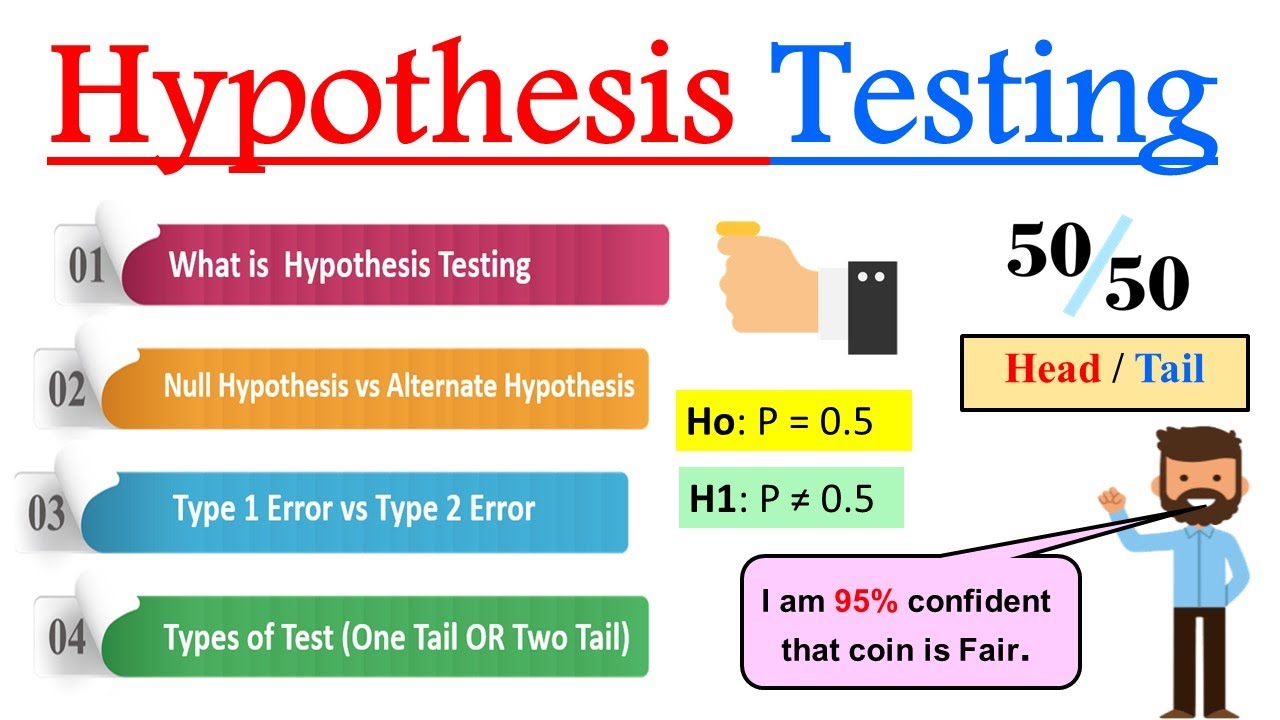
What is Hypothesis Testing in Statistics ? | Introduction to Hypothesis Testing

Chi Square Test Part 2 [Independence of attributes] Hypothesis Test MBS first Semester Statistics
What is a hypothesis test? A beginner's guide to hypothesis testing!
5.0 / 5 (0 votes)
