LEARN THIS SIMPLE FOREX DAY TRADING STRATEGY 2023 | How to MASTER Multiple Time Frame Analysis 💰
Summary
TLDRエマニュエルが価格アクショントレーディングの基本的な側面である複数時間枠分析について解説。スケーパー、デイトレーダー、スイングトレーダー、ポジショントレーダーにとっても重要なこの分析手法は、適切なトレード決定を下すための鍵。エマニュエルは、週足、日足、さらには1時間足のチャートを用いて、トレンドや市場構造を特定し、価格がどこへ向かうかを予測するのではなく、予測する。また、エントリーポイントを見つけるために低時間枠のチャートで共通点を探し、戦略に応じて実行する。
Takeaways
- 📈 多重時間枠分析は、スケープ、デイトレーダー、スイングトレーダー、ポジショントレーダーにとっても重要な基本分析手法です。
- 🔍 トレーダーの役割は価格を予測するのではなく、価格がどこへ向かうかを予測することです。
- 🗓️ 多重時間枠分析を始める際には、まず長期的な時間枠(月間、週間、または日足)から分析を始めることをお勧めします。
- 📊 トレンドと市場構造を特定することは、週足などの長期時間枠での価格アクション分析において重要です。
- 📉 売り手が市場をコントロールしている時には、価格が低い低を目指すことに注意を払うべきです。
- 📈 買い手が市場をコントロールしている時には、価格が高い高を目指すことを理解することが必要です。
- 🔑 市場構造の変化は、価格がどのように動くかを予測する鍵です。
- 📌 重要な拒絶ポイントや市場の関心領域を特定することは、価格がどこで反発するかを理解する上で役立ちます。
- 🛑 短期時間枠では、エントリーポイントを探す際に価格の反発や引き戻しを探します。
- 🎯 トレーディング戦略は、高い時間枠の分析に基づいて取引を実行するためのものです。
- 🚫 トレーダーは市場の流れに逆らうのではなく、市場が提供する最も高い確率で勝つために待つべきです。
Q & A
マルチタイムフレーム分析とは何ですか?
-マルチタイムフレーム分析とは、異なるタイムフレームを使って価格がどこへ向かうかを予測する手法です。これはスカラーパーやデイトレーダー、スイングトレーダー、ポジショントレーダーにとって基本的な分析手法の一つです。
トレーダーの役割は価格を予測することですか?
-いいえ、トレーダーの役割は価格を予測するのではなく、価格がどこへ向かうかを予期することです。
マルチタイムフレーム分析を始める際に最初に行うべきことは何ですか?
-最初に行うべきことは、価格アクションによってガイドされることです。つまり、大きなピクチャの確認を得るために、高いタイムフレームから分析を開始します。
分析を始める際に使用するおすすめのタイムフレームは何ですか?
-月間、週間、または日間のタイムフレームから分析を開始することが推奨されます。特に週間タイムフレームがよく使われます。
価格アクションにおいて重要な2つの要素は何ですか?
-価格アクションにおいて重要な2つの要素は、トレンドの特定と市場構造の理解です。これにより、市場の流れを把握することができます。
市場構造が示すことは何ですか?
-市場構造は、買い手が市場を制御しているときには高い高と低い高を作り、売り手が市場に入るときは低い低をターゲットとすることで、市場の流れを示します。
価格が市場構造を破った場合、次に起こり得る可能性は何ですか?
-価格が市場構造を破った場合、市場はさらに低いレベルに移動する可能性があります。これは売り手が市場を制御していることを示すシグナルです。
デイリータイムフレームで価格が低い低と低い高を作り始めた場合、これはどのようなシグナルを送っていますか?
-これは売り手が市場を制御しており、価格はさらなる低下を続ける可能性があることを示すシグナルです。
エントリーポイントを見つけるために低いタイムフレームで何を探しますか?
-低いタイムフレームでは、価格がどのように反応するか、またどのようなレベルで引き戻しが発生する可能性があるかを探します。これにより、エントリーポイントを見つけることができます。
トレーダーが価格の可能性を予測することによって市場から排除されるバイアスとは何ですか?
-トレーダーが価格のさまざまな可能性を予測することによって、市場から自分のバイアスを排除し、より客観的な分析を行えます。
スクリプトの最後に言及された「生きて自由を」とはどのような意味ですか?
-「生きて自由を」とは、トレーダーが自己の意志で生き、自己の意思で取引を行って自由を手に入れることを意味しています。これはチャンネルのモットーであり、トレーダーが自己完結的であることが重要であると示しています。
Outlines

Этот раздел доступен только подписчикам платных тарифов. Пожалуйста, перейдите на платный тариф для доступа.
Перейти на платный тарифMindmap

Этот раздел доступен только подписчикам платных тарифов. Пожалуйста, перейдите на платный тариф для доступа.
Перейти на платный тарифKeywords

Этот раздел доступен только подписчикам платных тарифов. Пожалуйста, перейдите на платный тариф для доступа.
Перейти на платный тарифHighlights

Этот раздел доступен только подписчикам платных тарифов. Пожалуйста, перейдите на платный тариф для доступа.
Перейти на платный тарифTranscripts

Этот раздел доступен только подписчикам платных тарифов. Пожалуйста, перейдите на платный тариф для доступа.
Перейти на платный тариф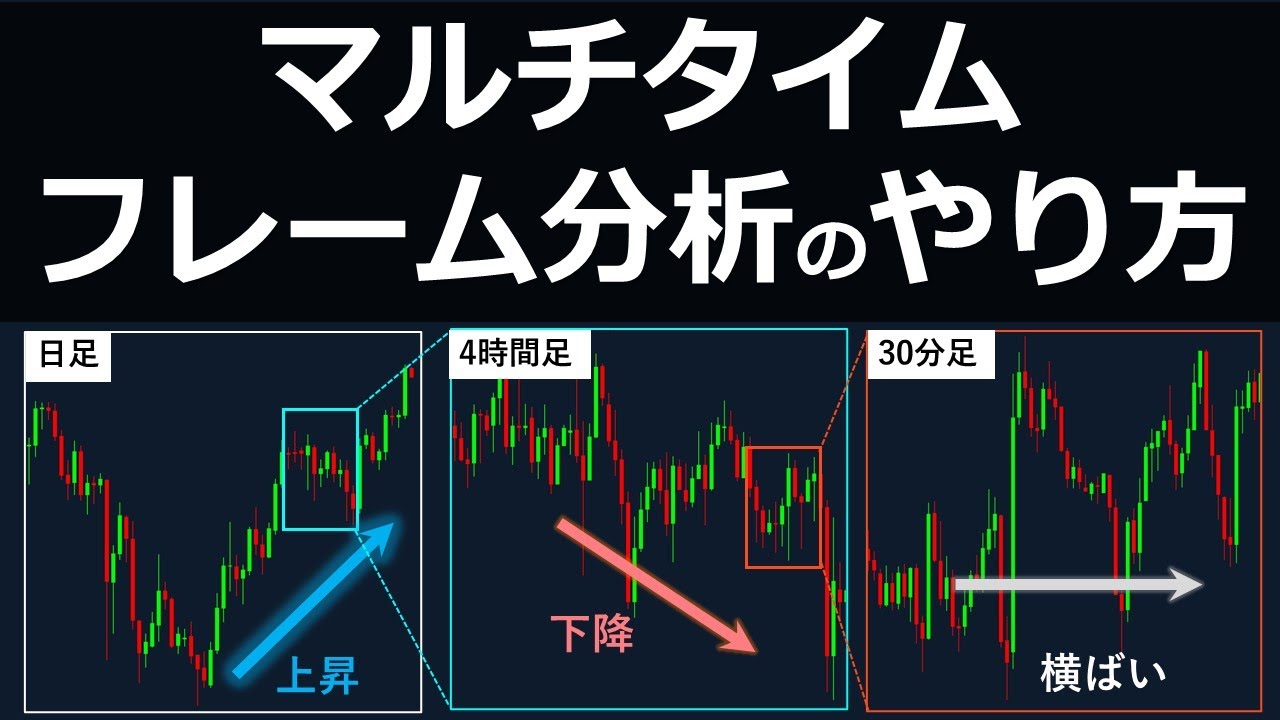


5.0 / 5 (0 votes)
