Koefisien Determinasi Regresi - Analisis Data Bivariat (bagian 3) - Fase F
Summary
TLDRThis video focuses on understanding the coefficient of determination (R²) in regression analysis. It builds upon a previous lesson on regression equations and the line of best fit. Using an example of students carrying lunch boxes and its effect on reducing waste, the video explains how to calculate R² using Excel. The coefficient of determination shows how much the independent variable (X) influences the dependent variable (Y), with 78.64% of the variation in Y explained by X. The video encourages viewers to practice these concepts using similar problems.
Takeaways
- 😀 The video begins by discussing regression equations and the concept of the line of best fit.
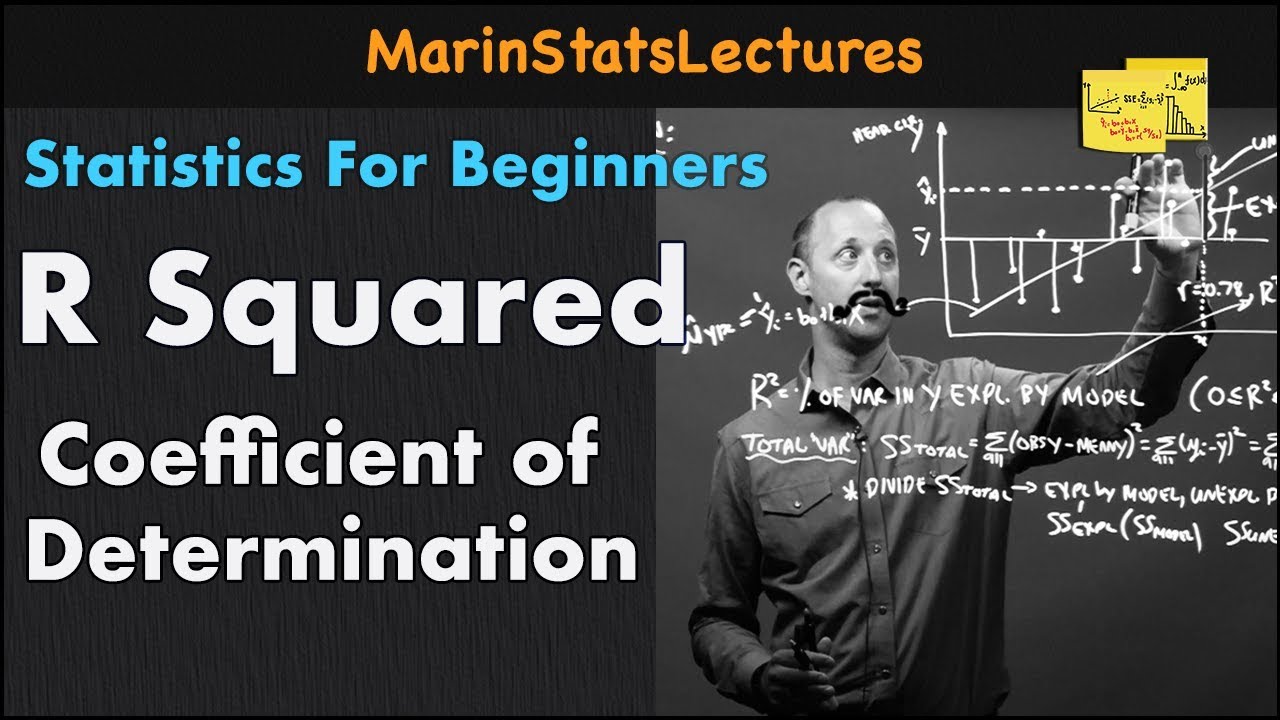
- 😀 The main focus of this video is on the coefficient of determination in regression analysis.
- 😀 The goal is to understand the association between cause and effect in regression analysis.
- 😀 A regression equation example is provided: y = 139.42 - 0.11x, showing how the number of students with lunch boxes affects the school’s waste.
- 😀 The task is to determine how much the variable x (number of students with lunch boxes) influences the variable y (amount of waste reduction).
- 😀 The learning objective is to calculate the coefficient of determination (R^2) using tools like Microsoft Excel.
- 😀 The coefficient of determination helps determine the percentage of variation in y that is explained by the regression equation.
- 😀 The formula for calculating R^2 is explained: R^2 = JKR / JKT, where JKR is the regression sum of squares and JKT is the total sum of squares.
- 😀 Two formulas are provided for calculating R^2, both yielding the same result for consistency in analysis.
- 😀 The final coefficient of determination value is 78.64%, meaning 78.64% of y (waste reduction) can be explained by the regression model, while the remaining 22.36% is influenced by other factors.
Q & A
What is the main topic discussed in this video?
-The video focuses on understanding the coefficient of determination in regression analysis, including how to interpret it and calculate it using Microsoft Excel.
What is the equation of the regression discussed in the video?
-The regression equation provided in the video is: y = 139.42 - 0.11x.
What is the interpretation of the regression equation y = 139.42 - 0.11x?
-The equation suggests that for every additional student who brings a lunchbox, the amount of waste in the school decreases by 0.11 kg.
What is the main goal of the lesson in this video?
-The lesson aims to teach viewers how to calculate and interpret the coefficient of determination (R^2) and understand the cause-and-effect relationship between variables using regression analysis.
How is the coefficient of determination (R^2) calculated?
-The coefficient of determination (R^2) is calculated using the formula: R^2 = JKR / JKT, where JKR is the sum of squares due to regression, and JKT is the total sum of squares.
What is the meaning of the coefficient of determination (R^2)?
-The coefficient of determination (R^2) indicates the percentage of the variation in the dependent variable (y) that can be explained by the independent variable (x) in the regression model.
What value of R^2 was calculated in the video, and what does it mean?
-The R^2 value calculated in the video is 78.64%. This means that 78.64% of the variation in waste (y) can be explained by the number of students bringing lunchboxes (x). The remaining 22.36% is influenced by other factors.
What is the significance of a 78.64% R^2 value in this context?
-A 78.64% R^2 value indicates a strong positive relationship between the number of students bringing lunchboxes and the reduction in waste. However, it also suggests that there are other factors not accounted for in the model that contribute to the remaining 22.36% of the variation.
Why is it important to understand the cause-and-effect relationship in regression analysis?
-Understanding the cause-and-effect relationship helps in interpreting how changes in one variable (x) influence another variable (y), providing insights into the strength and direction of that relationship.
What tools were suggested for calculating the coefficient of determination?
-Microsoft Excel or similar spreadsheet software was suggested as the tool for calculating the coefficient of determination using the formulas provided in the video.
Outlines

Этот раздел доступен только подписчикам платных тарифов. Пожалуйста, перейдите на платный тариф для доступа.
Перейти на платный тарифMindmap

Этот раздел доступен только подписчикам платных тарифов. Пожалуйста, перейдите на платный тариф для доступа.
Перейти на платный тарифKeywords

Этот раздел доступен только подписчикам платных тарифов. Пожалуйста, перейдите на платный тариф для доступа.
Перейти на платный тарифHighlights

Этот раздел доступен только подписчикам платных тарифов. Пожалуйста, перейдите на платный тариф для доступа.
Перейти на платный тарифTranscripts

Этот раздел доступен только подписчикам платных тарифов. Пожалуйста, перейдите на платный тариф для доступа.
Перейти на платный тарифПосмотреть больше похожих видео

Teori Regresi Linier Sederhana (Part 2) - Statistika Parametrik

Uji Regresi Linier Sederhana Dengan SPSS | Pembahasan Lengkap!

Uji t dan Uji F dalam Analisis Regresi Berganda dengan SPSS Lengkap

Modul 12 (StatSos2) - Konsep Dasar Regresi Linear Sederhana
R Squared or Coefficient of Determination | Statistics Tutorial | MarinStatsLectures
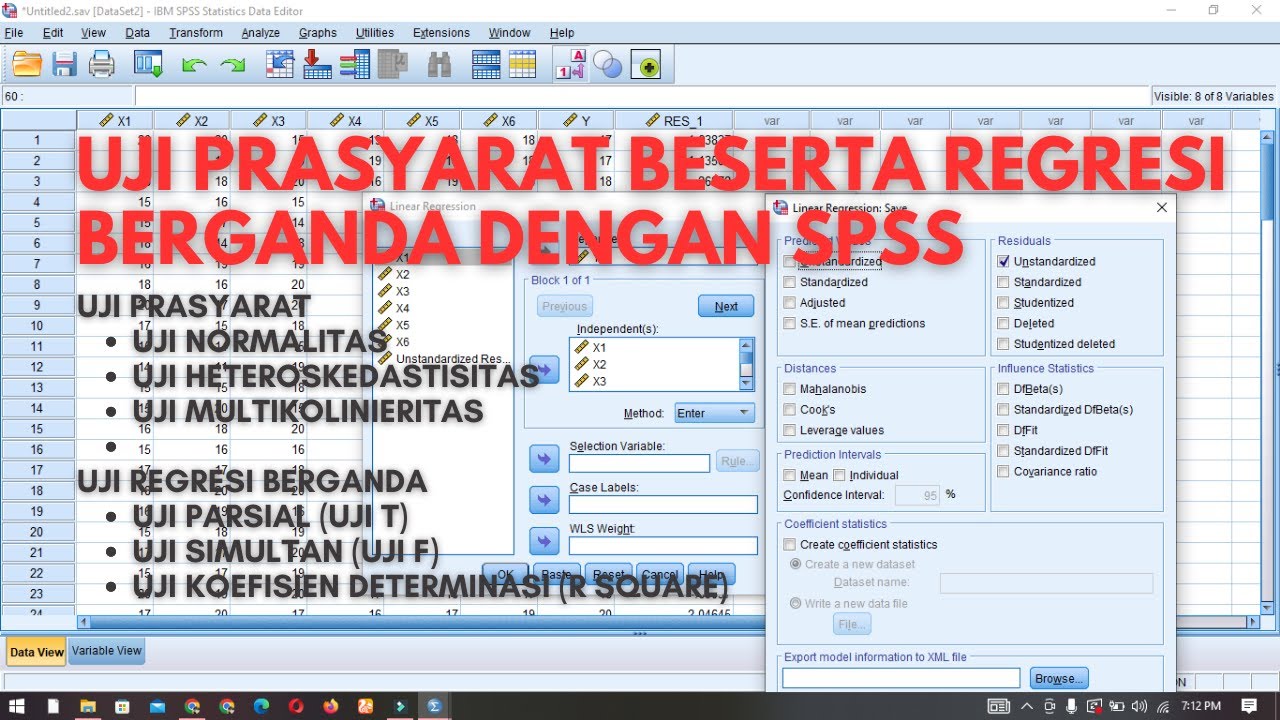
Tutorial Uji Asumsi Klasik (Prasyarat) Beserta Uji Regresi Berganda Dengan SPSS
5.0 / 5 (0 votes)
