Power Query - Looping through Columns
Summary
TLDRIn this Power Query tutorial, James demonstrates how to loop through columns and apply recursive transformations to calculate percentage values dynamically. Using functions like `Table.TransformColumns`, `List.Accumulate`, and `Table.ColumnNames`, he shows how to iterate through portfolio columns, calculate the sum, and convert stock data into percentages without hardcoding column names. The tutorial highlights the importance of understanding state and current values in recursion, making it a valuable lesson for anyone looking to optimize their Power Query processes for scalable, efficient solutions.
Takeaways
- 😀 Learn how to iterate through columns in Power Query without hardcoding values, applying calculations to each column dynamically.
- 😀 Discover how to use the `Table.TransformColumns` function in Power Query to transform data by applying functions to columns.
- 😀 Understand how to calculate the percentage of a total value for each stock in a portfolio using Power Query.
- 😀 Explore the `List.Sum` function in Power Query to calculate the total value of all items in a specific column.
- 😀 The process of converting stock values to percentages involves dividing each value by the total sum of the respective portfolio column.
- 😀 Utilize `Table.ColumnNames` to dynamically fetch column names in Power Query and filter them based on specific keywords (e.g., 'portfolio').
- 😀 Learn how to use `List.Select` to filter column names that match a pattern (e.g., those starting with 'portfolio').
- 😀 Gain an understanding of case-insensitive comparison using `Text.Contains` with an ignore case option in Power Query.
- 😀 Master the concept of `List.Accumulate`, a looping and recursion function in Power Query, which allows for iterative transformations over lists.
- 😀 Realize how state and current variables work in `List.Accumulate`, which iterates over a list, updating the state with each iteration.
- 😀 The script demonstrates how to apply the concept of recursion to iterate through all columns starting with 'portfolio', without hardcoding any column names.
Q & A
What is the main focus of the Power Query tutorial in this video?
-The tutorial focuses on demonstrating how to loop and apply recursion in Power Query to transform data, specifically by calculating the percentage of total stock holdings in a portfolio.
What is the dataset used in the tutorial?
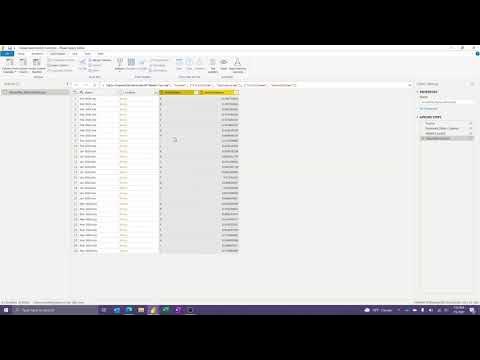
-The dataset consists of stock codes as rows and various portfolios as columns, with each value representing the number of stocks within each portfolio.
What is the primary goal of the Power Query function shown in the video?
-The goal is to convert the values in each portfolio column into percentages of the total stock holdings within that column.
What is the function 'Table.TransformColumns' used for in Power Query?
-The 'Table.TransformColumns' function is used to apply a transformation to each column in a table, such as converting the stock amounts into percentages based on the total for each portfolio column.
How does the video suggest handling the iteration of portfolio columns without hardcoding their names?
-The tutorial demonstrates how to use the 'Table.ColumnNames' function to get all column names, then filters them to only include those starting with 'portfolio' using the 'List.Select' function, avoiding hardcoding.
Why does the video emphasize using 'List.Accumulate' in the process?
-'List.Accumulate' is used to iterate over a list of columns (such as portfolio columns), applying transformations iteratively while maintaining a 'state' and a 'current' value, making the process dynamic and efficient.
What is the significance of 'state' and 'current' in the 'List.Accumulate' function?
-In 'List.Accumulate', 'state' holds the result of the previous iteration, and 'current' represents the current element being processed. These two variables work together to apply transformations iteratively across the list.
What is the role of the 'seed' value in the 'List.Accumulate' function?
-The 'seed' value in 'List.Accumulate' represents the initial value to start the accumulation process. In the tutorial, this is set as the table of data, which is then transformed through each iteration.
What does the tutorial mean by 'transforming' the columns during the iteration process?
-Transforming the columns means applying a calculation (such as dividing each stock holding by the total sum) to convert the values in each portfolio column into percentages, iteratively across multiple columns.
How does the solution handle adding new columns, such as 'portfolio 8'?
-The solution dynamically adapts to new columns by using the iteration process based on column names that start with 'portfolio'. When a new portfolio column is added, the script automatically includes it in the transformation without needing additional modifications.
Outlines

Этот раздел доступен только подписчикам платных тарифов. Пожалуйста, перейдите на платный тариф для доступа.
Перейти на платный тарифMindmap

Этот раздел доступен только подписчикам платных тарифов. Пожалуйста, перейдите на платный тариф для доступа.
Перейти на платный тарифKeywords

Этот раздел доступен только подписчикам платных тарифов. Пожалуйста, перейдите на платный тариф для доступа.
Перейти на платный тарифHighlights

Этот раздел доступен только подписчикам платных тарифов. Пожалуйста, перейдите на платный тариф для доступа.
Перейти на платный тарифTranscripts

Этот раздел доступен только подписчикам платных тарифов. Пожалуйста, перейдите на платный тариф для доступа.
Перейти на платный тарифПосмотреть больше похожих видео
5.0 / 5 (0 votes)


