How to use Power Query in Power BI | Microsoft Power BI for Beginners
Summary
TLDRIn this Power BI tutorial, viewers learn to use Power Query for effective data transformation before visualization. The presenter demonstrates how to import data from Excel, including pivot tables and formatted overviews. Key steps include cleaning the dataset by removing unnecessary rows, promoting headers, and changing data types for monetary values. The tutorial emphasizes the importance of restructuring data for usability, specifically by unpivoting date columns to create a more effective layout. Finally, the video guides viewers on applying transformations to load the cleaned data into Power BI, making it ready for insightful visualizations.
Takeaways
- 😀 Power Query is a powerful tool for transforming data before importing it into Power BI.
- 📊 Users can add, delete, or change data types of columns within Power Query.
- 🔍 The tutorial focuses on using an Excel sheet called 'apocalypse food prep' as the data source.
- 🛒 The Excel sheet includes a pivot table and a formatted purchase overview that will be transformed in Power BI.
- 📈 The Power Query Editor allows users to manipulate data with various functions like removing rows, splitting columns, and adding new columns.
- ✂️ Removing unnecessary rows and promoting the first row as headers are essential steps in preparing data.
- 💵 The correct data type is crucial; monetary values should be formatted as fixed decimal numbers for accurate representation.
- 🚫 Filtering out unwanted data, such as subtotals and grand totals, helps create cleaner datasets for visualizations.
- 🔄 Unpivoting columns transforms date columns into rows, making the data more usable for analysis and visualizations.
- ✅ Finalizing changes with 'Close and Apply' loads the transformed data into Power BI for further analysis.
Q & A
What is the primary purpose of Power Query in Power BI?
-Power Query allows users to transform data before loading it into Power BI, enabling actions like adding or deleting columns and changing data types.
What types of data transformations can be performed using Power Query?
-Users can perform various transformations such as removing columns, splitting columns, filtering rows, changing data types, and unpivoting data.
What data sources are referenced in the tutorial?
-The tutorial references an Excel file from a previous video titled 'Apocalypse Food Prep,' which includes various items and their costs.
Why are the null values at the top of the data table removed?
-The null values are removed to clean up the data, making it more usable for visualizations in Power BI.
How does Power Query determine the data types of imported columns?
-Power Query analyzes the data and assigns data types based on its best guess, which can be adjusted by the user as needed.
What is the significance of the 'Applied Steps' section in Power Query?
-'Applied Steps' documents every transformation made to the data, allowing users to revert changes or review previous versions if necessary.
What is the outcome of unpivoting the data in Power Query?
-Unpivoting the data reorganizes it, turning column headers (like dates) into row values, making it suitable for visualizations.
How can a user rename columns in Power Query?
-Users can rename columns by double-clicking the column header or by accessing the query settings on the right side of the Power Query editor.
What happens after clicking 'Close and Apply' in Power Query?
-Clicking 'Close and Apply' saves all transformations made to the data and loads it into Power BI for further visualization.
What is the final step taken in the tutorial before creating visualizations?
-The final step is to close the Power Query editor and apply all the transformations to load the cleaned and structured data into Power BI.
Outlines

This section is available to paid users only. Please upgrade to access this part.
Upgrade NowMindmap

This section is available to paid users only. Please upgrade to access this part.
Upgrade NowKeywords

This section is available to paid users only. Please upgrade to access this part.
Upgrade NowHighlights

This section is available to paid users only. Please upgrade to access this part.
Upgrade NowTranscripts

This section is available to paid users only. Please upgrade to access this part.
Upgrade NowBrowse More Related Video

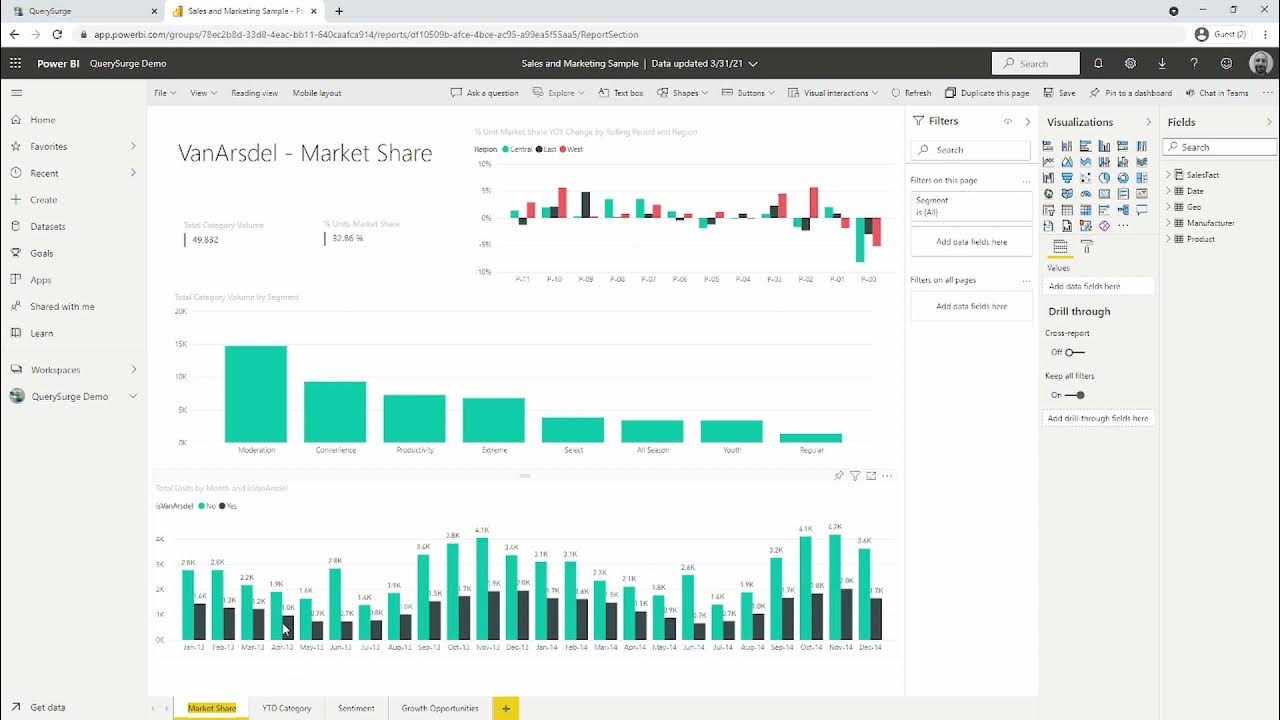
Using QuerySurge to Test & Validate Data in Microsoft Power BI

Dasar Dasar Power BI | Pembuatan Dashboard Covid-19 Indonesia

This is how I actually clean data using Power Query

Power BI Tutorial For Beginners | Create Your First Dashboard Now (Practice Files included)

Can’t INPUT DATA in Power BI? Here is a WRITE BACK Option with Power Apps!

E-1
5.0 / 5 (0 votes)