Pembahasan Analisis Komponen Utama (Part 1) | Review Konsep
Summary
TLDRIn this video, the speaker delves into the concept of Principal Component Analysis (PCA), explaining its importance in reducing correlations between variables in data analysis. The main components discussed include the definition, properties, and application of PCA. Key points include how to determine principal components, the challenges of selecting the number of components, and the difference between using correlation and covariance matrices. The video also outlines various methods to decide how many components to keep, such as using cumulative variance, eigenvalue thresholds, and scree plots. The information is presented in a comprehensive and engaging manner, offering valuable insights into PCA.
Takeaways
- 😀 PCA is a method for transforming correlated variables into uncorrelated principal components, improving regression analysis by addressing multicollinearity.
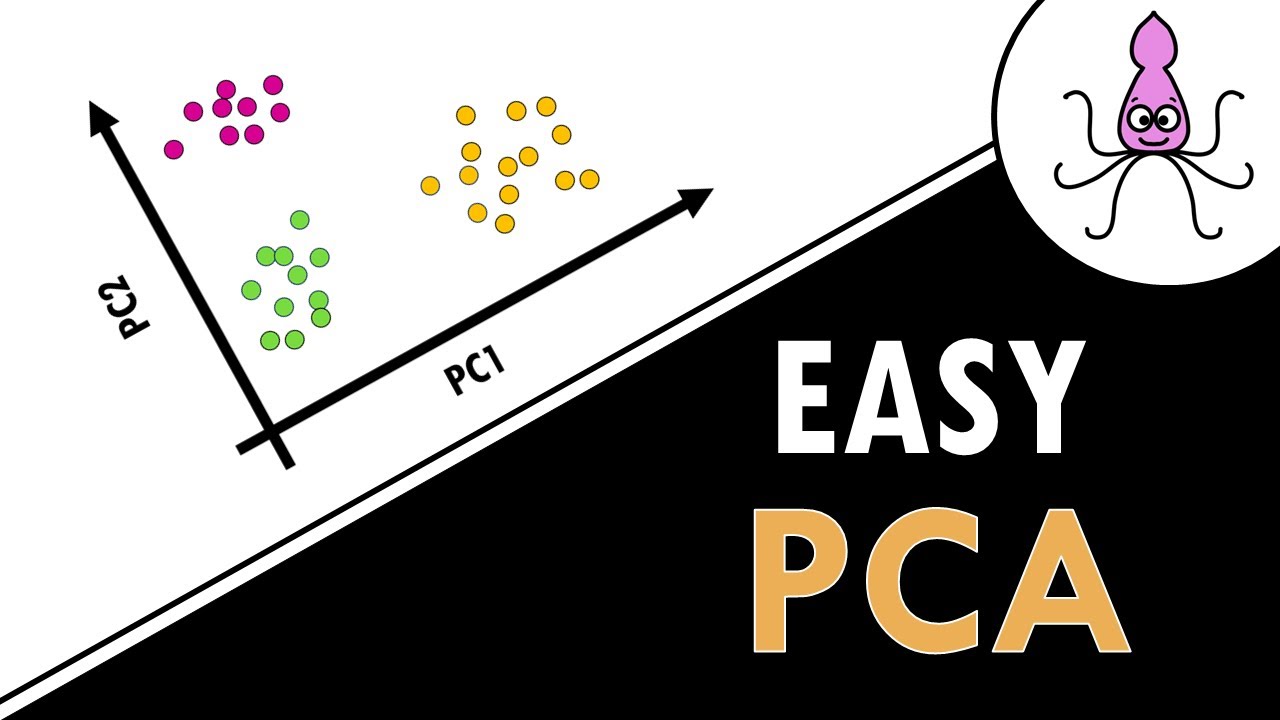
- 😀 Principal Components (PCs) are linear combinations of the original variables that capture the most significant variance in the data.
- 😀 The primary goal of PCA is to maximize variance and eliminate redundancy by ensuring the components are orthogonal (uncorrelated).
- 😀 Eigenvectors and eigenvalues are key to calculating principal components; eigenvalues represent the variance captured by each component.
- 😀 The correlation matrix is recommended when the original variables have different units, while the covariance matrix is used for variables with the same units.
- 😀 The first step in PCA is to convert a set of correlated variables into principal components that no longer correlate with each other.
- 😀 When selecting the number of components, it’s crucial to decide based on the cumulative variance, typically targeting 90% or more.
- 😀 The Kaiser criterion (eigenvalue > 1) and Jolliffe criterion (eigenvalue > 0.7) are two commonly used methods to determine how many components to keep.
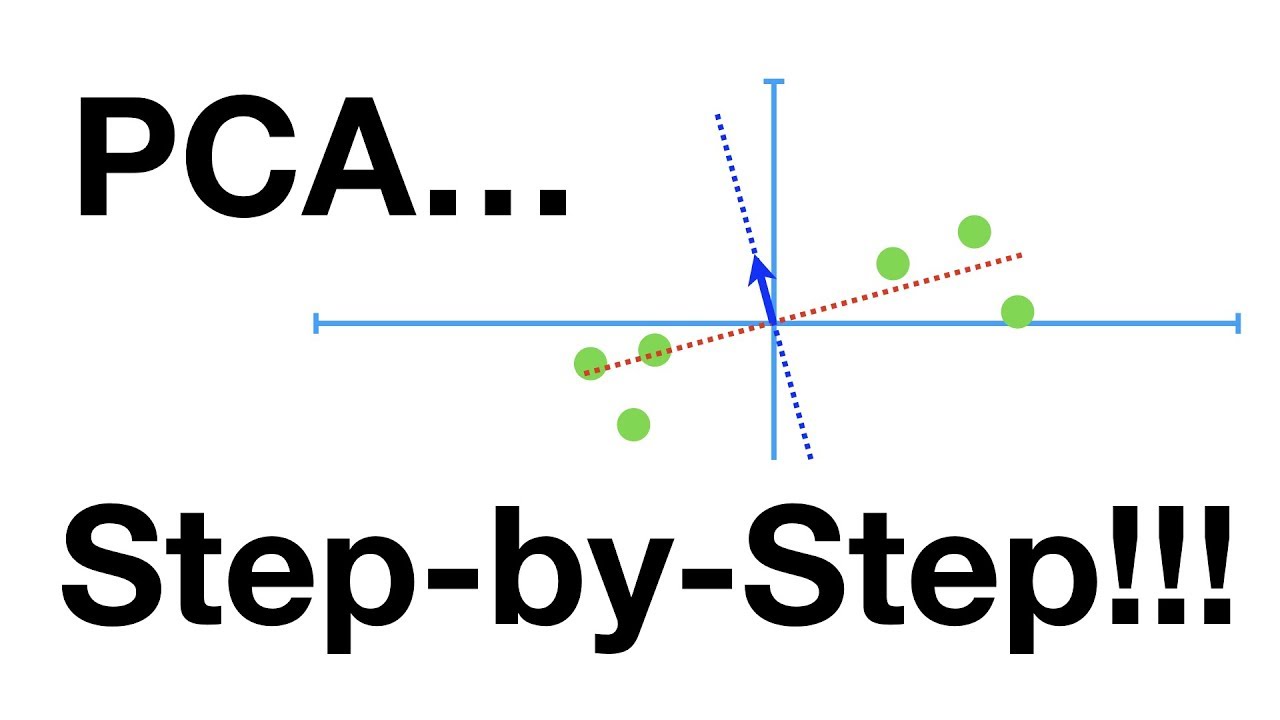
- 😀 A scree plot helps visualize the eigenvalues, allowing the selection of the number of components at the point where the curve flattens (elbow method).
- 😀 PCA can be used to improve model performance by reducing dimensionality, eliminating multicollinearity, and preventing overfitting.
Q & A
What is the main topic discussed in this transcript?
-The main topic discussed is Principal Component Analysis (PCA), specifically focusing on its concepts, methods, and applications.
What are the three key components to understand about Principal Component Analysis?
-The three key components are: 1) Understanding the concept and definition of principal components, 2) Recognizing the problems related to principal components, 3) Understanding the application of PCA in regression analysis.
Why is it necessary to transform correlated variables into principal components?
-This transformation is necessary to resolve issues in certain analyses that require variables to be uncorrelated, such as multiple regression with multicollinearity assumptions.
What is the principle behind principal components?
-The principle is that principal components should contain maximum variance, meaning they hold the most information about the original variables. They must also be orthogonal (uncorrelated) to each other.
What is the formula for defining principal components?
-Principal components are defined as a linear combination of the original variables, represented as: X = a * Xᵀ, where 'a' is the coefficient of the principal component and Xᵀ is the transpose of the original variable matrix.
What is the role of eigenvalues in PCA?
-Eigenvalues represent the variance explained by each principal component. The contribution of each principal component to the total variance is determined by the eigenvalue corresponding to that component.
What are the two options for determining the principal components: correlation matrix or covariance matrix?
-When dealing with variables with different units, it's recommended to use the correlation matrix. However, if all variables are on the same scale, the covariance matrix can also be used.
How do we determine how many principal components to select?
-There are three methods: 1) Cumulative variance percentage (e.g., select components that explain at least 90% of the variance), 2) Kaiser’s method (eigenvalues greater than or equal to 1), 3) Scree plot method (select the number of components where the slope starts to level off).
What is the difference between using the correlation matrix and the covariance matrix in PCA?
-The correlation matrix standardizes the variables to have the same scale, which is especially useful when variables have different units of measurement. The covariance matrix assumes that the variables have the same scale.
How does PCA address the issue of multicollinearity?
-PCA addresses multicollinearity by transforming the original correlated variables into a set of uncorrelated principal components, thus avoiding the problem of multicollinearity in regression models.
Outlines

Этот раздел доступен только подписчикам платных тарифов. Пожалуйста, перейдите на платный тариф для доступа.
Перейти на платный тарифMindmap

Этот раздел доступен только подписчикам платных тарифов. Пожалуйста, перейдите на платный тариф для доступа.
Перейти на платный тарифKeywords

Этот раздел доступен только подписчикам платных тарифов. Пожалуйста, перейдите на платный тариф для доступа.
Перейти на платный тарифHighlights

Этот раздел доступен только подписчикам платных тарифов. Пожалуйста, перейдите на платный тариф для доступа.
Перейти на платный тарифTranscripts

Этот раздел доступен только подписчикам платных тарифов. Пожалуйста, перейдите на платный тариф для доступа.
Перейти на платный тарифПосмотреть больше похожих видео

Week 3 Lecture 13 Principal Components Regression

StatQuest: PCA main ideas in only 5 minutes!!!
Principal Component Analysis (PCA) - easy and practical explanation

PCA and Biplot Analysis to Identify Determinants of the Human Development Index in Central Java

Lec-46: Principal Component Analysis (PCA) Explained | Machine Learning
StatQuest: Principal Component Analysis (PCA), Step-by-Step
5.0 / 5 (0 votes)
