Week 3 Lecture 13 Principal Components Regression

Machine Learning- Balaraman Ravindran
4 Aug 202114:28

Summary

TLDRThis script delves into the concept of Singular Value Decomposition (SVD) and Principal Component Analysis (PCA) in the context of data analysis. It explains how SVD breaks down a matrix into diagonal entries and eigenvectors, and how PCA uses these components to find directions with maximum variance for data projection. The script highlights the benefits of PCA, such as reducing dimensionality while retaining significant variance, and discusses potential drawbacks, like ignoring the output variable when selecting principal components. It also touches on the importance of considering both input data and output variables for optimal feature selection in regression and classification tasks.

Takeaways

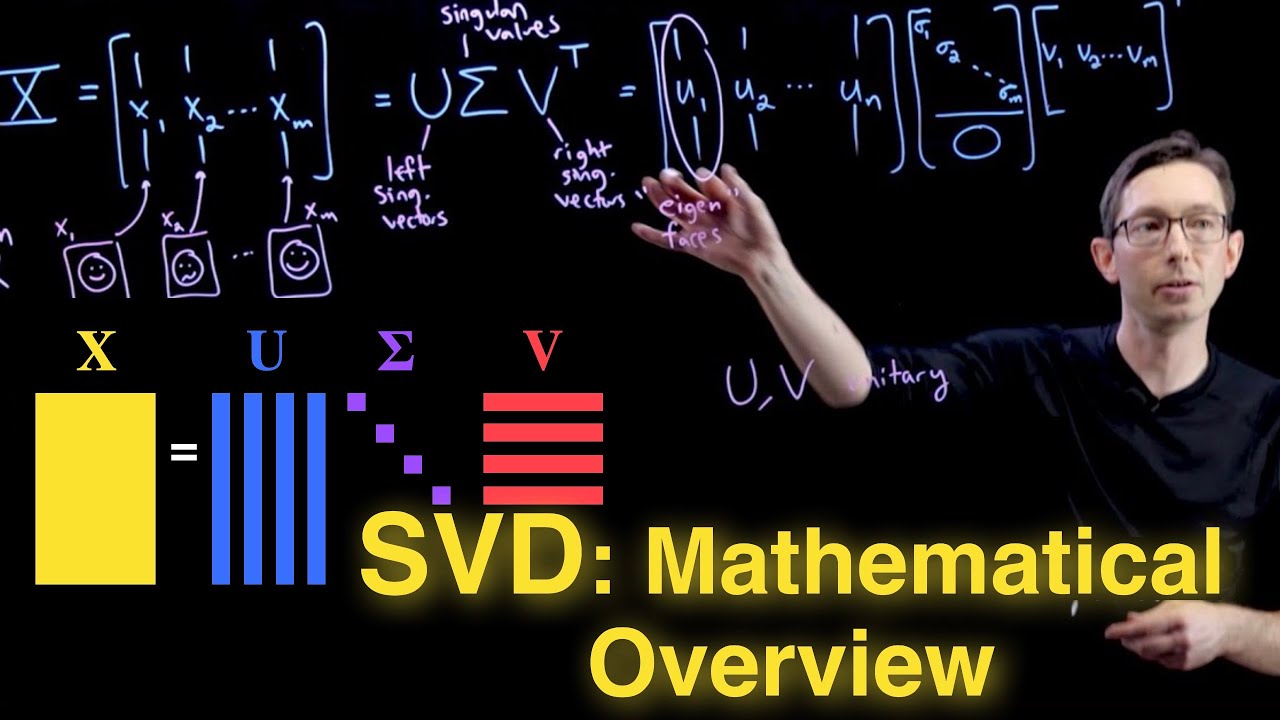
  • 📊 The script discusses the concept of Singular Value Decomposition (SVD), where D is a diagonal matrix with eigenvalues or singular values, and V and U are matrices containing eigenvectors that span the column space of X.
  • 🔍 Principal Component Analysis (PCA) is mentioned as a method that involves finding the covariance matrix of centered data and then performing an eigendecomposition to find principal component directions.
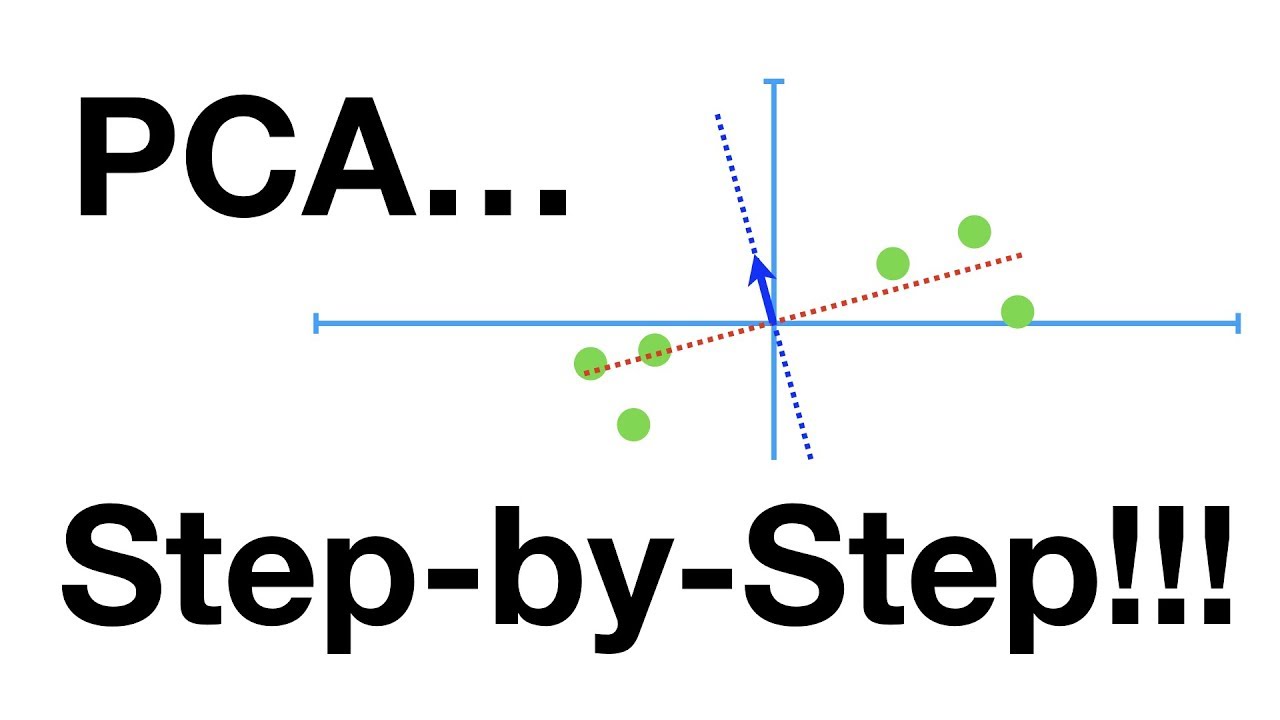
  • 🌐 The principal component directions are orthogonal and each explains a certain amount of variance in the data, with the first principal component (V1) having the maximum variance.
  • 📈 The script explains that projecting data onto the first principal component direction (V1) results in the highest variance among all possible projection directions, indicating the spread of data.
  • 🔄 The process of PCA involves selecting principal components to perform regression, where each component is orthogonal and can be used independently in regression models.
  • 📉 The script highlights that the first principal component direction minimizes the reconstruction error when only one coordinate is used to summarize the data.
  • 📝 Principal Component Regression (PCR) is introduced as a method to perform regression using the selected principal components, with the regression coefficients being determined by regressing Y on the principal components.
  • 🚫 A drawback of PCR is that it only considers the input data and not the output, which might lead to suboptimal directions if the output has specific characteristics.
  • 📊 The script contrasts ideal PCA directions with those that might be more suitable for classification tasks, where considering the output can lead to better separating surfaces.
  • 📉 The importance of considering both the input data and the output when deriving directions for tasks like classification is emphasized, as it can lead to more effective models.
  • 🔑 The takeaways from the script highlight the mathematical foundations of PCA and its applications in feature selection and regression, as well as the importance of considering the output in certain contexts.

Q & A

  • What is the singular value decomposition (SVD) mentioned in the script?

    -Singular Value Decomposition (SVD) is a factorization of a matrix into three matrices: D, a diagonal matrix with singular values on its diagonal; V, a P x P matrix with eigenvectors; and U, an N x P matrix that spans the column space of the original matrix X.

  • How is the covariance matrix related to the principal component analysis (PCA)?

    -In PCA, the covariance matrix is derived from the centered data. The eigendecomposition of this covariance matrix provides the principal components, which are the directions of maximum variance in the data.

  • What are the principal component directions of X?

    -The principal component directions of X are the columns of the V matrix obtained from the eigendecomposition of the covariance matrix of the centered data.

  • Why is the first principal component direction considered the best for projecting data?

    -The first principal component direction is considered the best for projecting data because it captures the highest variance among all possible directions, resulting in the most spread-out data projection.

  • What is the significance of the orthogonality of principal components?

    -Orthogonality of principal components means they are uncorrelated, allowing for independent regression analysis along each principal component direction, which can be useful for feature selection and data reconstruction.

  • How does the script relate the concept of variance to the principal components?

    -The script explains that each principal component captures the maximum variance in its respective orthogonal space. The first principal component has the highest variance, followed by the second, and so on, with each subsequent component capturing the highest variance in the space orthogonal to the previously selected components.

  • What is the role of the intercept in principal component regression?

    -In principal component regression, the intercept is the mean of the dependent variable (y-bar), which is added to the regression model to account for the central tendency of the data.

  • How does the script discuss the limitation of principal component regression?

    -The script points out that principal component regression only considers the input data (X) and not the output, which might lead to suboptimal directions for regression if the output's characteristics are not taken into account.

  • What is the script's example illustrating the importance of considering the output in regression?

    -The script uses a classification example where projecting data in the direction of maximum variance might mix different classes, leading to poor predictive performance. Instead, a direction that separates the classes clearly, even if it has lower variance, might be more beneficial for regression or classification.

  • How does the script suggest improving the selection of principal components for regression?

    -The script suggests that considering the output data along with the input data might help in selecting better directions for regression, especially in cases where the output data has specific characteristics that could influence the choice of principal components.

  • What is the general process of feature selection using principal components?

    -The general process involves selecting the first M principal components, performing univariate regression on each, and adding the outputs until the residual error becomes small enough, indicating a satisfactory fit.

Outlines

00:00

📊 Introduction to Singular Value Decomposition (SVD) and Principal Component Analysis (PCA)

This paragraph introduces the concept of singular value decomposition (SVD), where a matrix X is decomposed into three components: a diagonal matrix D with eigenvalues or singular values, a P x P matrix V containing eigenvectors, and an N x P matrix U that spans the column space of X. It then relates SVD to principal component analysis (PCA), explaining that PCA involves finding the covariance matrix of centered data, and then performing an eigendecomposition on it. The paragraph emphasizes that the eigenvectors (V matrix) from this decomposition represent the principal component directions of X, which are significant for feature selection and dimensionality reduction.

05:14

🔍 Exploring Principal Component Directions and Variance Maximization

The second paragraph delves into the properties of principal component directions derived from PCA. It explains how projecting the data onto the first eigenvector (V1) results in a vector (Z1) that captures the maximum variance among all possible projection directions. The paragraph uses a two-dimensional example to illustrate how projecting data onto different directions can yield varying degrees of spread, with the principal component direction showing the most spread, indicating higher variance. It also touches on the concept of reconstruction error, stating that the first principal component direction minimizes this error, and discusses the orthogonal nature of the principal components, each capturing the highest variance in their respective subspaces.

10:26

📉 Principal Component Regression and Its Limitations

This paragraph discusses the application of principal components in regression analysis, known as principal component regression. It describes how to incorporate the principal components into a regression model by regressing Y on the transformed data Zm, where Zm is a function of the principal components. The paragraph also points out a limitation of principal component regression: it focuses solely on the input data (X) and does not consider the output (Y), which might lead to suboptimal directions for projection if the output's characteristics are not aligned with the variance captured by the principal components. The discussion includes a hypothetical example comparing the effectiveness of different projection directions in a classification context, highlighting the importance of considering the output when selecting directions for analysis.

Mindmap

Keywords

💡Diagonal Matrix

A diagonal matrix is a type of square matrix that has all off-diagonal entries equal to zero and non-zero entries only on the main diagonal. In the context of the video, diagonal entries are referred to as eigenvalues or singular values, which are crucial in the singular value decomposition (SVD) process. The script mentions that 'D is a diagonal matrix where the diagonal entries are your eigenvalues or singular values.'

💡Eigenvalues

Eigenvalues are a key concept in linear algebra, representing the scalar values that characterize the linear transformation described by a matrix. They are used in the script to describe the diagonal entries of a diagonal matrix in SVD, where 'the diagonal entries are your eigenvalues or singular values.'

💡Singular Value Decomposition (SVD)

Singular Value Decomposition is a factorization of a matrix into three matrices, often used in signal processing and statistics. The script explains it as 'essentially your singular value decomposition that we talked about.' It is a method to decompose a matrix into a product of three matrices, which are useful for various applications, including dimensionality reduction.

💡Eigenvectors

Eigenvectors are vectors that, when a linear transformation is applied to them, only change by a scalar factor (the eigenvalue). In the script, 'V is a P x P matrix which has your eigenvectors,' referring to the matrix that contains the eigenvectors associated with the eigenvalues in the SVD process.

💡Covariance Matrix

The covariance matrix is a measure of how much two random variables change together. In the script, it is mentioned as 'the covariance matrix of the centered data,' which is used to find the eigendecomposition, a key step in principal component analysis (PCA).

💡Principal Component Analysis (PCA)

PCA is a statistical technique used to emphasize variation and bring out strong patterns in a dataset. The script refers to PCA in the context of feature selection and dimensionality reduction, stating 'when I talk more about generally about feature selection I will come back to PCA.'

💡Principal Component Directions

Principal component directions are the axes in the transformed space that capture the maximum variance in the data. The script explains that 'the columns of... are called the principal component directions of X,' which are derived from the eigenvectors of the covariance matrix.

💡Variance

Variance is a measure of the dispersion of a set of data points. In the script, it is used to describe the spread of the data when projected onto different directions, such as 'the resulting vector Z1 will have the highest variance among all possible directions in which I can project X.'

💡Projection

Projection in this context refers to the process of mapping data points onto a lower-dimensional subspace. The script uses the term to describe how data is transformed, for example, 'projecting my data X on the first eigenvector direction.'

💡Reconstruction Error

Reconstruction error is the error that occurs when trying to reconstruct the original data from a lower-dimensional representation. The script mentions it in the context of PCA, stating 'the error in reconstruction would have been these bars that I did the projection over.'

💡Orthogonal Directions

Orthogonal directions are directions that are perpendicular to each other. In PCA, the principal components are orthogonal, which allows for independent regression analysis. The script states 'what each one V1 to VP will be orthogonal,' highlighting the property of principal components.

💡Feature Selection

Feature selection is the process of choosing a subset of relevant features for use in model construction. The script mentions it in relation to PCA, indicating that 'PCA is good' for feature selection, as it helps in identifying the most informative components of the data.

💡Residual

Residual refers to the difference between the observed values and the values predicted by a model. In the script, it is used to describe the error in the model when using principal components for regression, 'I can keep adding the dimensions until my residual becomes small enough.'

Highlights

Introduction to singular value decomposition (SVD) and its components: D (diagonal matrix with eigenvalues/singular values), V (matrix of eigenvectors), and U (matrix spanning the column space of X).

Linking SVD to principal component analysis (PCA) and the concept of covariance matrix S.

Explanation of how PCA involves eigendecomposition of the covariance matrix of centered data.

Principal component directions as columns of the V matrix derived from PCA.

PCA's utility in feature selection and its implications for regression and classification.

The concept of projecting data X onto the first eigenvector direction to achieve maximum variance.

Illustration of how variance is maximized in the direction of the first principal component.

Discussion on the reconstruction of data using principal components and the associated error.

The first principal component direction minimizes reconstruction error.

Orthogonality of principal components and their role in explaining variation in data.

The method of independently performing regression on orthogonal dimensions.

Principal component regression and its limitation of focusing only on input data.

The process of adding principal components to a regression model until residuals are sufficiently small.

The drawback of PCA in cases where output data should also be considered for optimal direction selection.

Example of how PCA might not be optimal for classification if the principal direction does not separate classes well.

The importance of considering both input data and output labels when deriving directions for regression or classification.

The potential for better prediction accuracy when considering the output in the selection of principal components.

Transcripts

play00:00

 Right so D is a diagonal  

play00:17

matrix right where the diagonal entries are  your Eigen values if ideally or otherwise  

play00:25

known as singular values right V is a V is a  P x P matrix which has your eigenvectors and U  

play00:41

the N x P matrix which typically spans your column  space as X the same column space as X okay so this  

play00:51

is essentially your singular value decomposition  that we talked about so.  

play01:07

So if you if you look at singular value  decomposition or what is called the  

play01:11

principal component analysis literature you  will find the following you will find that  

play01:17

they will talk about the covariance matrix  S okay what is the covariance matrix is a  

play01:35

covariance matrix this is essentially if  you think of whatever we have been doing,  

play01:39

so far what would be this centered right  it is centered so I take the centered data  

play01:50

okay then this becomes this right so  X tends to l then what I do is I find  

play02:04

the eigendecomposition of that. I find the  Eigen decomposition of the covariance matrix  

play02:13

right.  

play02:15

So I can essentially write this as so the same  V and D that I wrote here assuming this was okay  

play02:33

so if I take XC so basically I am going to get  the same thing right so it is essentially like  

play02:37

doing singular value decomposition right and  retrieving the V matrix right I am essentially  

play02:44

taking the XTX which is the covariance matrix  of the centered data okay and I am finding the  

play02:54

Eigenvalue decomposition of that so D2 would be  the Eigen vectors of XTX so this is standard stuff  

play03:03

you should know okay. So the columns of  

play04:00

so they are called the principal component  directions of X. So there are a couple of nice  

play04:05

things about the principal component directions,  so we will talk about just one so I will actually  

play04:12

come back to PCA slightly later right when I talk  more about generally about feature selection not  

play04:18

just in the context of regression but when I talk  with generally about feature selection I will come  

play04:22

back to PCA and tell you at least show you why  PCA is good right now I will just tell you why  

play04:27

PCA is good I will come back later and then I will  show you why PCA is good right.  

play04:31

So suppose I take so where V1 is the eigenvector  corresponding to the first eigenvalue right  

play04:45

eigenvector corresponding to the first eigenvalue  so essentially what this means is I am projecting  

play04:49

my data X on the first eigenvector direction  okay so the resulting vector Z1 okay will have  

play04:58

the highest variance among all possible directions  in which I can project X right.  

play05:13

So what does that mean right suppose this is  X okay this is not x and y okay so it is a  

play05:30

two-dimensional X this is x now I am claiming that  V1 will be such that when I project X onto V1 I  

play05:42

will have the maximum variance right, so in this  case it will be some direction like this okay and  

play05:50

projecting X onto this essentially means that  right, so you can see that the data is pretty  

play06:03

spread out it goes from here to here right on  the other hand if I had taken a direction let  

play06:09

us say that looks like that right so if I look  at projection of the data right, so you can  

play06:22

look at the spread it is a lot lesser in that  direction than in the original direction I did  

play06:29

the projection I know it looks pretty confusing to  look at but the people can get my point right it  

play06:37

is in the original direction that way the data  was a lot more spread out as opposed to this  

play06:42

direction where the data is lot more compact  when I project it on to that direction.  

play06:47

So that is essentially what I am saying so  z1 right is essentially the projected data  

play06:52

onto that direction onto X like z1 actually has a  highest variance among all the directions in which  

play07:07

I can project the data right and consequently  you can also show things like if I am looking  

play07:15

to reconstruct the data original data and I say  that you can only give me one coordinate right  

play07:24

so you have to summarize the data in a single  coordinate and now I am going to measure the  

play07:29

data measure the error in reconstruction right.  If you looked at it so the error in reconstruction  

play07:35

would have been these bars that I did the  projection over right.  

play07:39

That would be the error in reconstruction, so  I have the original data so that is the data  

play07:43

so now I will give you this coordinates  now I have to reconstruct the data right  

play07:51

so essentially this will be the errors so the  first principal component direction the first  

play07:58

principal component direction is the one that  has the smallest reconstruction error. First  

play08:05

principal comment direction will be the one  that has the smallest reconstruction so we can  

play08:09

show a lot of nice properties about this. So I will actually come back and do this later  

play08:12

when we talk about the general feature selection  okay but here you can see the first thing you  

play08:18

can see what each one V1 to VP will be orthogonal  right, so I have gotten my orthogonal directions  

play08:27

right and the thing to notice is a lot of the  variation in the data is explained by V1 or V1  

play08:35

has the maximum variance likewise you take out V1  right you take out V1 so now what you have your  

play08:43

data lies in some kind of a p - 1 dimensional  space right and the direction in that the space  

play08:50

which has the highest variance is p2 it turns  out that so V1 has the highest variance over  

play08:58

the data. So in this space orthogonal to V1 ,  V2 has the highest variance right in the space  

play09:05

orthogonal to V1 and V2, V3 will have the highest  variance and so on so forth so essentially now  

play09:10

what you can do is hey I am going to take all  this directions one at a time right and I will  

play09:17

do my regression right because each is orthogonal  I can independently do the regression I can add  

play09:23

the outputs and I can keep adding the dimensions  until my residual becomes small enough that make  

play09:34

sense. So I will just keep adding this orthogonal  dimensions until my residual becomes small enough  

play09:38

at that point I stop. So this is essentially the idea behind  

play10:25

so remember we are working with the centered  data right, so you automatically add in your  

play10:30

intercept which is y bar the coefficient is y  bar right and then your if you if you choose to  

play10:37

take the first M principal components your thing  will be θmZm where Zm is given by this right and  

play10:51

θm is essentially regressing Y on Zm right so  that is a univariate regression expression we  

play10:59

know that well now so this gives you the principal  component regression fit so one of the drawbacks  

play11:08

of doing principal component regression is  that I am only looking at the data the input  

play11:14

right I am not looking at the output. So it could very well be that once I consider  

play11:19

what the output is right I might want to change  the directions a little bit right, so I can give  

play11:27

you an example is easier for me to draw if I  think of classification.  

play12:00

Let us say this is the data and what would be  the principal component direction you want to  

play12:04

choose something like this right so that would be  the ideal direction that you would want to choose  

play12:12

okay so now what will happen the data will get we  get projected like this right but suppose I tell  

play12:26

you that. Suppose I tell you that  

play12:41

that is fine that these three were in a different  class and if you want to think of it in terms of  

play12:50

regression let us assume that these three have  an output of -1 and these four have an output  

play12:55

of +1 okay now if you think of this direction so  the +1 and -1 are hopelessly mixed up right the  

play13:05

+1 and -1 are hopelessly mixed up and I cannot I  cannot draw is give a smooth prediction of which  

play13:12

will be +1 which will be -1 on the other hand if  you project onto a direction like this right the  

play13:17

variance is small right I agree the variance  is much smaller but if you think about it. So  

play13:22

all the -1 go to one side right all the +1 go to  one side, so now if I want to do a prediction on  

play13:33

this so it will be like okay this is this side is  -1 and that side is +1 I can essentially do a fit  

play13:39

like this which will give me a lot lesser error  than the other case right so in cases where you  

play13:46

are having an output that is specified for you  already it might be beneficial to look at the  

play13:52

output also when trying to derive directions as  opposed to just looking at the input data so in  

play13:59

classification you can see right in classification  this will be say class 1 this will be class 2  

play14:03

and having this direction allows you to have a  separating surface somewhere here right we talked  

play14:10

about classification in the first class right. So you just having a separating surface here  

play14:14

will be great but in this case if I am  projecting on this direction coming up  

play14:18

with a linear separating surface is going to be  hard everything gets completely mixed up.

Rate This

5.0 / 5 (0 votes)

Related Tags
Principal ComponentData AnalysisVariance MaximizationEigenvectorsCovariance MatrixFeature SelectionRegression AnalysisSingular ValueProjection DirectionData Spread