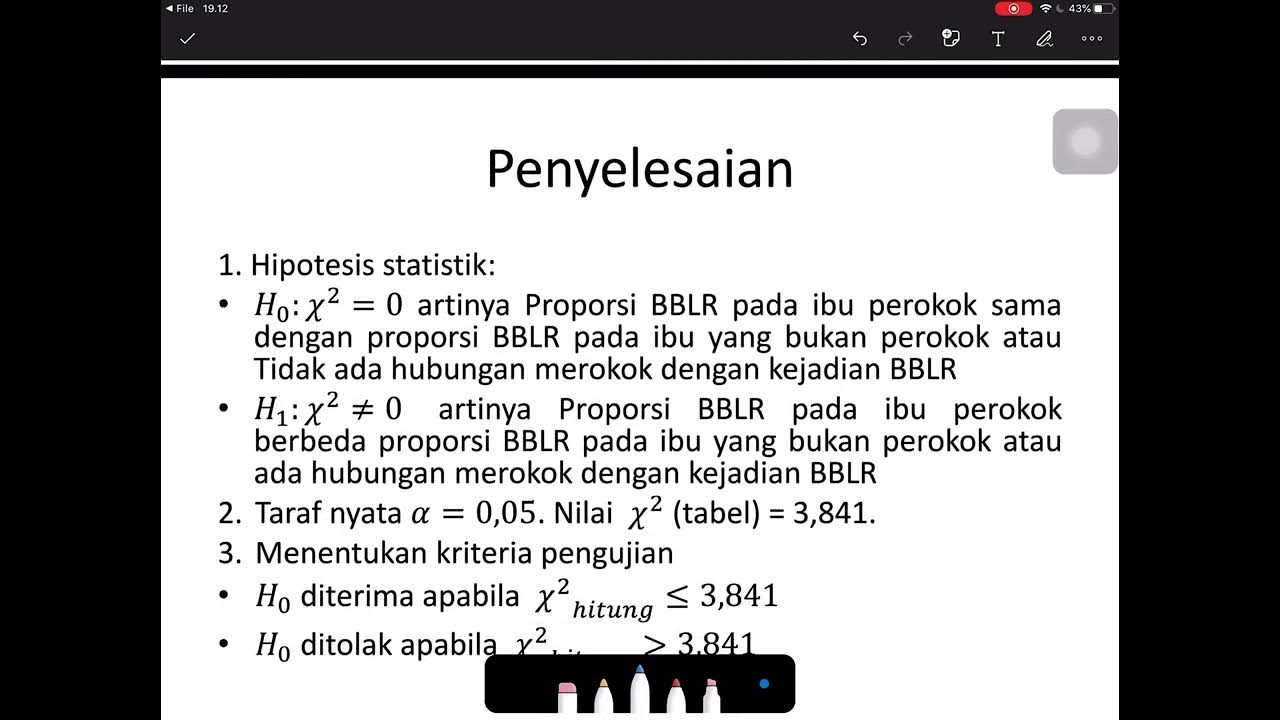
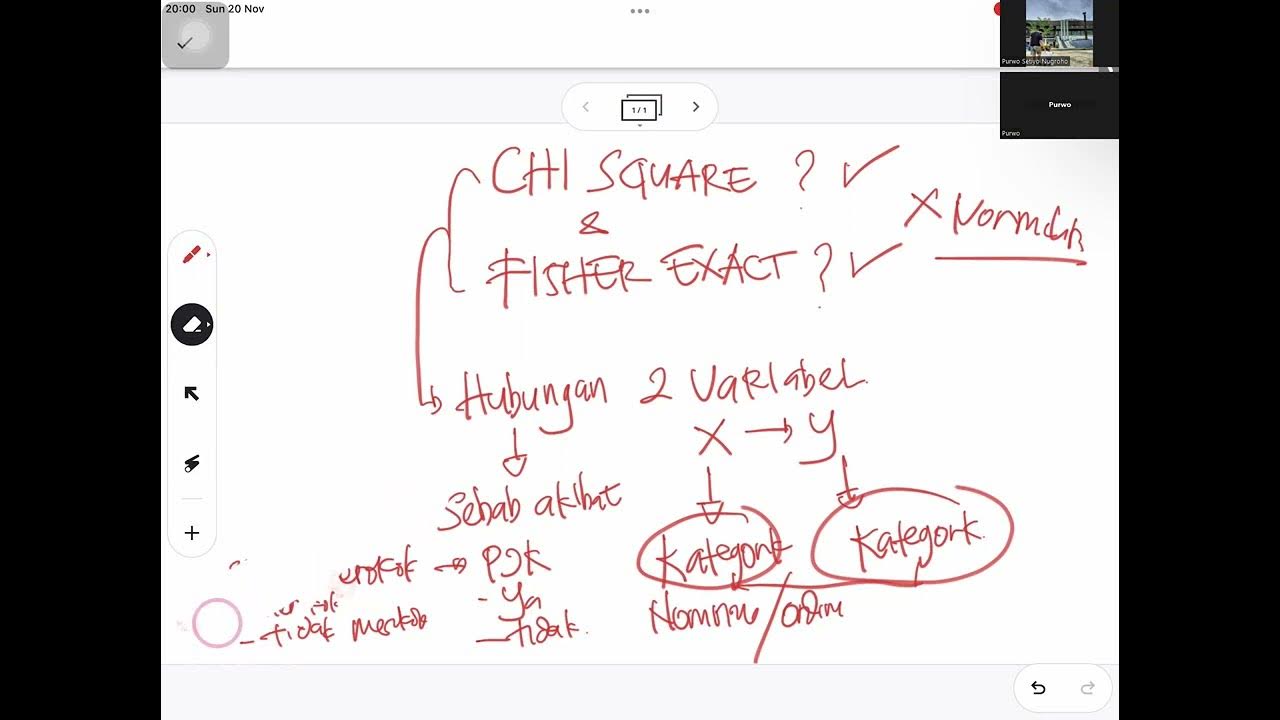
video 14.2. chi-square test of independence
Summary
TLDRThis video tutorial explains the chi-square test for independence, a statistical method used to determine if two nominal variables are related. Using a real-world example, the video explores the process of hypothesis testing, from formulating the null and alternative hypotheses to calculating the chi-square statistic. The instructor demonstrates the steps of the test using a contingency table, discusses expected vs. observed frequencies, and highlights how to interpret the results. By the end, viewers learn how to assess the relationship between caffeine consumption and the detection of hidden objects, rejecting or accepting the null hypothesis based on the chi-square statistic and critical value.
Takeaways
- 😀 The chi-square test of independence is used when both the outcome and independent variables are nominal (categorical).
- 😀 This test examines whether there is a relationship between two nominal variables, such as whether drinking caffeine affects the detection of hidden objects.
- 😀 The null hypothesis for this test assumes that there is no relationship between the two variables (e.g., caffeine and detection rates).
- 😀 The observed data in the chi-square test is compared to the expected data if the null hypothesis were true.
- 😀 The expected frequencies are calculated under the assumption that the null hypothesis is true, based on marginal frequencies from the observed data.
- 😀 The chi-square statistic is calculated using the formula: chi-square = sum of [(observed frequency - expected frequency)^2 / expected frequency] for each cell in the contingency table.
- 😀 In the given example, participants are grouped by whether they drank caffeine or decaffeinated coffee, and the outcome is whether they detected a hidden smiley face.
- 😀 The degrees of freedom for a chi-square test of independence is calculated using the formula: (number of rows - 1) * (number of columns - 1).
- 😀 A chi-square critical value is compared to the calculated test statistic to determine whether the null hypothesis should be rejected.
- 😀 If the test statistic exceeds the critical value, the null hypothesis is rejected, indicating that the two variables are dependent (not independent).
- 😀 In the example, the results suggest that caffeine consumption increased the detection of hidden objects, with caffeine drinkers having higher detection rates than decaf drinkers.
Q & A
What is the chi-square test of independence?
-The chi-square test of independence is used to determine if there is a significant relationship between two nominal variables. It tests whether the distribution of one variable is independent of the distribution of the other variable.
What are the two types of variables involved in a chi-square test of independence?
-In a chi-square test of independence, both the independent variable and the dependent variable must be nominal. The independent variable is used to group the data, while the dependent variable represents the outcome.
What example is used to demonstrate the chi-square test of independence in the transcript?
-The example involves testing whether drinking a caffeinated beverage increases the likelihood of detecting a hidden object. The two variables are whether participants drank caffeine or decaffeinated coffee, and whether they detected the hidden image.
What is the null hypothesis in a chi-square test of independence?
-The null hypothesis in a chi-square test of independence suggests that there is no relationship between the two variables being tested. For this example, it states that drinking caffeinated versus decaffeinated coffee has no effect on detecting the hidden image.
What are observed and expected frequencies in a chi-square test?
-Observed frequencies are the actual data collected during the experiment, while expected frequencies represent the distribution of data that would occur if the null hypothesis were true. The chi-square statistic is calculated by comparing the observed frequencies to the expected frequencies.
How are expected frequencies calculated in the chi-square test?
-Expected frequencies are calculated by using the marginal totals of the rows and columns in a contingency table. These values are distributed evenly assuming the null hypothesis is true, meaning there is no effect of the independent variable on the dependent variable.
What formula is used to calculate the chi-square statistic?
-The chi-square statistic is calculated by summing the squared difference between observed and expected frequencies, divided by the expected frequencies, for each cell in the contingency table: χ² = Σ ((O - E)² / E), where O is the observed frequency and E is the expected frequency.
How do you determine the degrees of freedom for a chi-square test of independence?
-The degrees of freedom for a chi-square test of independence is calculated using the formula: (number of rows - 1) * (number of columns - 1). For this example, with 2 rows and 2 columns, the degrees of freedom is 1.
What is the critical value in a chi-square test, and how is it used?
-The critical value in a chi-square test is the value from a chi-square distribution table that corresponds to the degrees of freedom and the chosen significance level (e.g., alpha = 0.05). If the chi-square test statistic exceeds the critical value, the null hypothesis is rejected.
What does it mean if the null hypothesis is rejected in a chi-square test of independence?
-Rejecting the null hypothesis means that the data suggests a significant relationship between the two variables. In the example, rejecting the null hypothesis would imply that drinking caffeine does affect the detection of hidden images, as evidenced by the difference in detection rates between caffeine and decaf drinkers.
Outlines

Этот раздел доступен только подписчикам платных тарифов. Пожалуйста, перейдите на платный тариф для доступа.
Перейти на платный тарифMindmap

Этот раздел доступен только подписчикам платных тарифов. Пожалуйста, перейдите на платный тариф для доступа.
Перейти на платный тарифKeywords

Этот раздел доступен только подписчикам платных тарифов. Пожалуйста, перейдите на платный тариф для доступа.
Перейти на платный тарифHighlights

Этот раздел доступен только подписчикам платных тарифов. Пожалуйста, перейдите на платный тариф для доступа.
Перейти на платный тарифTranscripts

Этот раздел доступен только подписчикам платных тарифов. Пожалуйста, перейдите на платный тариф для доступа.
Перейти на платный тарифПосмотреть больше похожих видео
5.0 / 5 (0 votes)


