MS Access - Reports Part 1: Basic reports
Summary
TLDRThis video tutorial on Microsoft Access reports teaches users how to create and format basic reports using data from tables and queries. It covers the steps for designing reports in Design View, adding components like labels, images, and lines, and formatting data fields for clarity. The report creation process is explained using the Report Wizard, with options for grouping, sorting, and adjusting layout settings like page orientation. The tutorial also emphasizes customizing headers, footers, and alignment for professional-looking printed reports.
Takeaways
- 😀 Reports in Microsoft Access help organize and summarize data in a more readable and printable format than raw tables.
- 😀 A report is based on a table or query and displays data in a structured layout that is easier to understand and present.
- 😀 Design View allows customization of report elements, including page headers, detail sections, and data binding to text boxes.
- 😀 The detail section repeats for each record, displaying values from the linked table or query fields.
- 😀 The Report Wizard in Access helps simplify report creation by allowing users to select specific fields, sort, and group data.
- 😀 Report headers, page headers, and footers are used to define the structure and display relevant information on each page.
- 😀 You can modify the appearance of labels and text boxes in the design view without affecting the underlying data they display.
- 😀 To improve readability, you can adjust field sizes, alignments, and page orientations (landscape or portrait).
- 😀 Adding design elements like labels, images, and lines between records can further enhance the report's visual appeal and clarity.
- 😀 Be mindful of excessive use of colors or design elements that may affect print quality or increase ink consumption.
- 😀 After designing the report, use Report View and Print Preview to assess the final layout and make adjustments as needed.
Q & A
What is the purpose of a report in Microsoft Access?
-A report in Microsoft Access is used to organize or summarize data from tables or queries, presenting it in a formatted, printable way that is easier to read than raw data in a table.
How does a report differ from a table or query in Access?
-A table stores raw data, while a query filters and organizes that data. A report, on the other hand, is specifically designed for printing and presenting the data in a more readable and structured format.
What are the main components of a report in Access?
-A report consists of labels (which describe the fields), text boxes (which display the actual data from the table or query), and sections like the page header and detail section.
Can you customize the labels in the report design view?
-Yes, labels in the report design view can be customized to change the text or formatting. However, altering the labels does not affect the actual data, as the text boxes are tied to the fields in the table.
What happens in the design view when you add or modify fields in a report?
-When you modify the fields in the design view, you can change the layout, size, and positioning of the fields. These changes will reflect in the report each time the detail section is repeated for each record.
What does the 'hash' symbol indicate in a report preview?
-The 'hash' symbol in a report preview indicates that the column is too narrow to display the full data. Adjusting the size of the field or making the page layout larger can resolve this issue.
How can you add extra elements like logos or lines to a report?
-Extra elements, such as logos and lines, can be added using the image and line components in the report design view. You can adjust the size, color, and position of these elements as needed.
What is the difference between the report header and page header in a report?
-The report header appears at the top of the first page only, while the page header appears at the top of every page in the report. The report header is typically used for the title or introductory information.
How do you modify the layout of a report, like changing from portrait to landscape?
-You can modify the layout by adjusting the page orientation in the report design options. Switching to landscape allows you to add more content horizontally and can make the report look more spacious.
What is the recommended approach to handle field labels in the report?
-Field labels should be clearly named to describe the data they represent. You can change the labels in the report design without affecting the underlying data, but ensure the labels are clear and consistent.
What are the best practices for printing a report in Access?
-When preparing a report for printing, ensure that the layout is clean and readable, avoid excessive colors, and check the report in Print Preview to confirm it will print as expected. Use page headers and footers effectively for consistency.
Outlines

Этот раздел доступен только подписчикам платных тарифов. Пожалуйста, перейдите на платный тариф для доступа.
Перейти на платный тарифMindmap

Этот раздел доступен только подписчикам платных тарифов. Пожалуйста, перейдите на платный тариф для доступа.
Перейти на платный тарифKeywords

Этот раздел доступен только подписчикам платных тарифов. Пожалуйста, перейдите на платный тариф для доступа.
Перейти на платный тарифHighlights

Этот раздел доступен только подписчикам платных тарифов. Пожалуйста, перейдите на платный тариф для доступа.
Перейти на платный тарифTranscripts

Этот раздел доступен только подписчикам платных тарифов. Пожалуйста, перейдите на платный тариф для доступа.
Перейти на платный тарифПосмотреть больше похожих видео

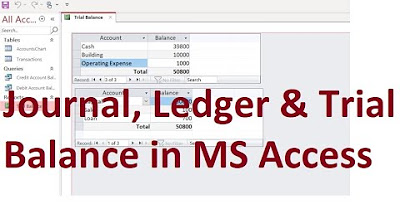
MS Access; Journal, Ledger & Trial Balance Database from scratch (File Available); Urdu/Hindi

Access: Introduction to Objects

Microsoft Access Tutorial - Beginners Level 1 (Quick Start)

MS Access - What is a database?

Belajar Microsoft Access untuk Pemula

Microsoft Access 2016 for Beginners: Creating a Database from Scratch
5.0 / 5 (0 votes)
