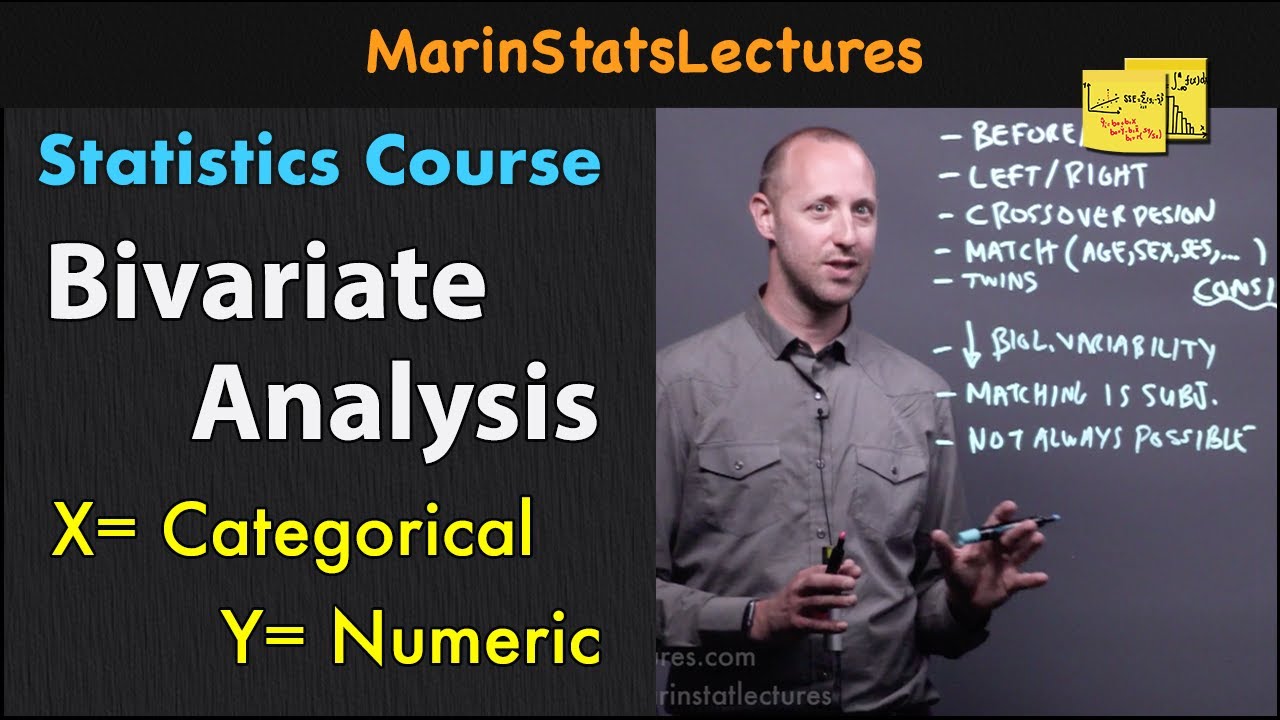
Bivariate Analysis Meaning | Statistics Tutorial #19 | MarinStatsLectures
Summary
TLDRThis video provides a comprehensive overview of bivariate analysis, focusing on the relationship between two variables, X and Y. It distinguishes between independent and dependent variables and discusses the foundations of hypothesis testing and confidence intervals. The video explores various analysis methods, including parametric and nonparametric approaches, along with resampling techniques. Through practical examples, such as drug treatment effects and smoking-related cancer risks, it illustrates different visualization and analysis methods for categorical and numeric data. The course aims to prepare learners for further exploration of multivariable analysis in subsequent modules.
Takeaways
- 😀 Bivariate analysis examines the relationship between two variables, typically represented as X (independent) and Y (dependent).
- 📊 X is often referred to as the independent variable, while Y is known as the dependent or outcome variable.
- 🔍 The primary goal of bivariate analysis is to determine how changes in X affect Y or to use X to predict Y.
- 📈 Confidence intervals provide a range where the true value is expected to lie, calculated as estimate ± margin of error.
- 🔗 Hypothesis testing involves comparing observed data to what would be expected under a null hypothesis and calculating p-values.
- ⚖️ Parametric methods require larger sample sizes and make specific assumptions about data distribution but are more powerful.
- 🔄 Nonparametric methods are suitable for smaller samples, have fewer assumptions, and are less sensitive to outliers.
- 🔁 Resampling approaches, like bootstrapping, allow flexibility in analysis without needing large sample sizes.
- 💊 An example of bivariate analysis includes comparing drug treatments (categorical X) and their effect on blood pressure (numeric Y).
- 📅 The course will progress from bivariate analysis to multivariable analysis, examining how multiple independent variables affect a single outcome.
Q & A
What is bivariate analysis?
-Bivariate analysis is the examination of the relationship between two variables, typically referred to as the independent variable (X) and the dependent variable (Y). It seeks to understand how changes in X affect Y.
What are the common names for the independent and dependent variables in bivariate analysis?
-The independent variable is often called the explanatory, predictor, or covariate variable, while the dependent variable is referred to as the outcome or response variable.
What foundational concepts are important for conducting bivariate analysis?
-Key foundational concepts include hypothesis testing and confidence intervals, which help in estimating true values and determining the significance of the observed data.
What is a parametric method in bivariate analysis?
-Parametric methods are statistical approaches that require larger sample sizes and make specific assumptions about the distribution of the data. They typically have higher power but are sensitive to outliers.
Can you provide an example of a nonparametric method?
-An example of a nonparametric method is the Wilcoxon signed-rank test, which is useful for analyzing data that do not meet the assumptions required for parametric tests.
How does resampling differ from parametric and nonparametric approaches?
-Resampling methods, like bootstrapping, do not necessarily require large sample sizes and make fewer assumptions. They provide more flexibility in estimates and hypotheses tested, unlike the more rigid structures of parametric methods.
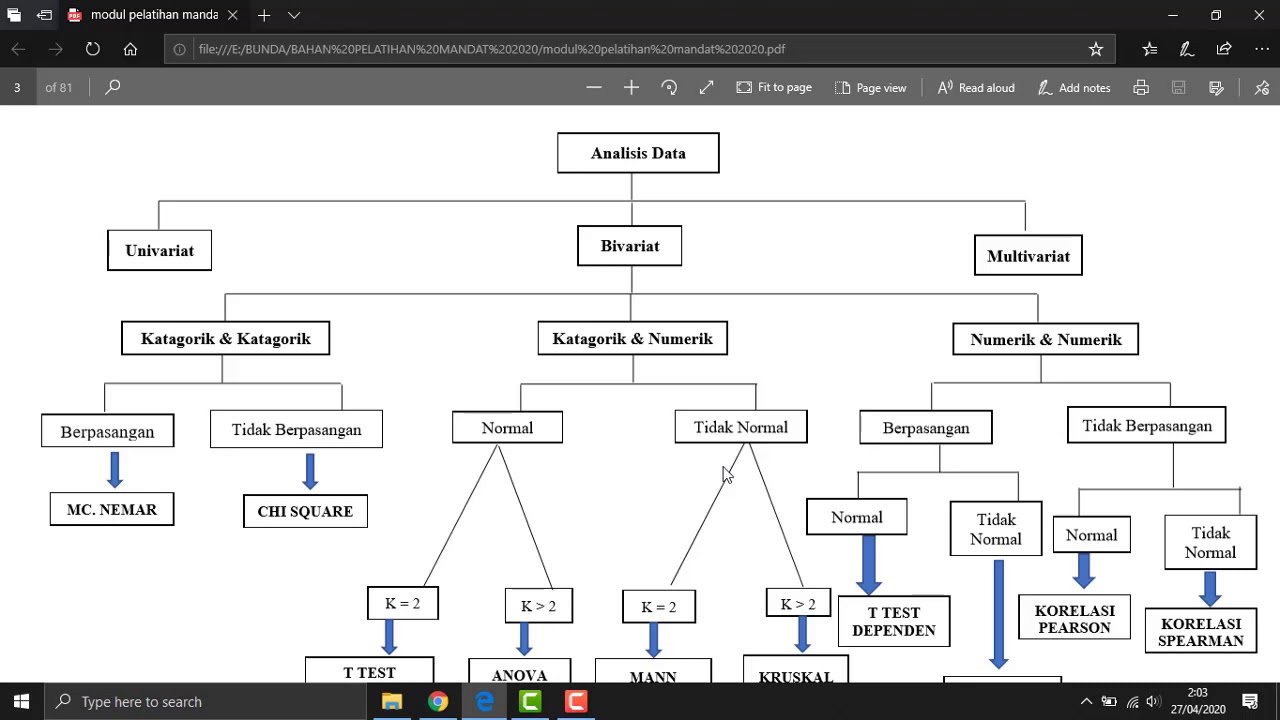
What type of visualization is suitable for categorical X and numeric Y variables?
-Side-by-side boxplots are an appropriate visualization for analyzing the relationship between a categorical independent variable and a numeric dependent variable.
What statistical methods can be used for analyzing two categorical variables?
-For two categorical variables, methods such as Pearson's chi-squared test and Fisher's exact test can be utilized to analyze their relationship.
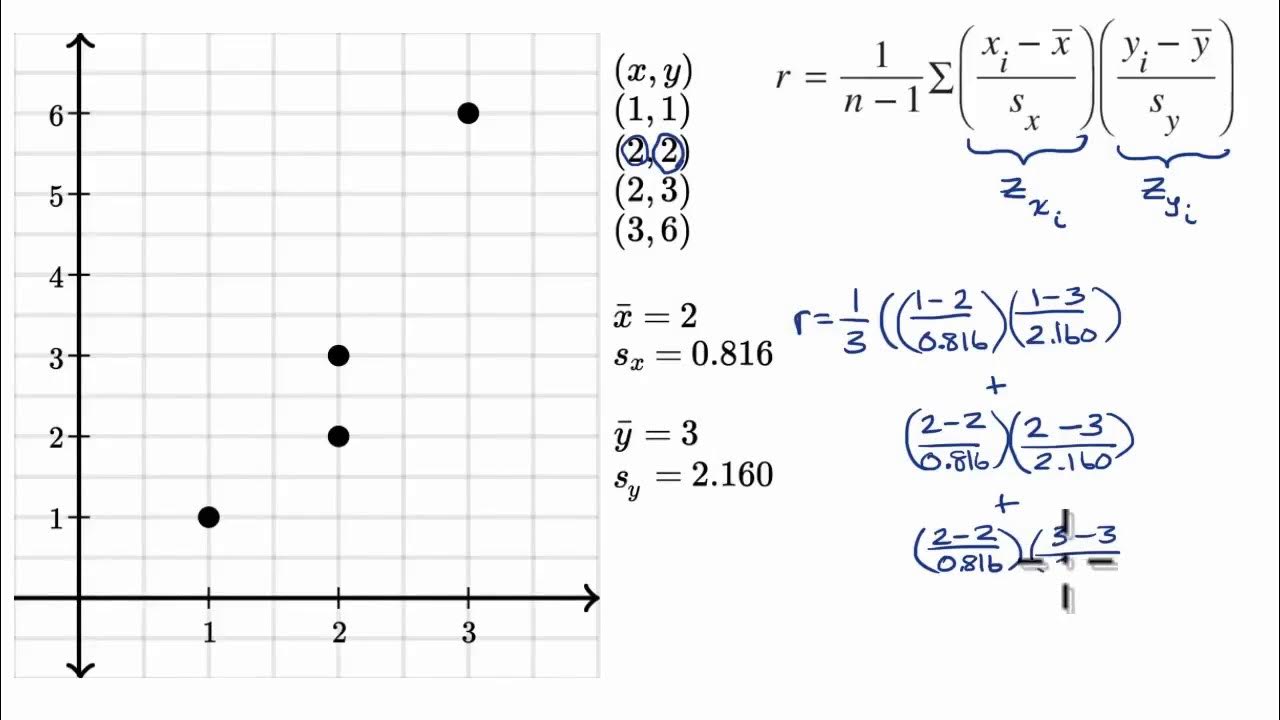
How do you visualize the relationship between two numeric variables?
-The relationship between two numeric variables can be visualized using scatter plots, which display individual data points for each pair of values.
What topics will be covered in future videos about bivariate analysis?
-Future videos will discuss the relationships between categorical variables, relationships between numeric variables, and foundational concepts for multivariable analysis.
Outlines

Этот раздел доступен только подписчикам платных тарифов. Пожалуйста, перейдите на платный тариф для доступа.
Перейти на платный тарифMindmap

Этот раздел доступен только подписчикам платных тарифов. Пожалуйста, перейдите на платный тариф для доступа.
Перейти на платный тарифKeywords

Этот раздел доступен только подписчикам платных тарифов. Пожалуйста, перейдите на платный тариф для доступа.
Перейти на платный тарифHighlights

Этот раздел доступен только подписчикам платных тарифов. Пожалуйста, перейдите на платный тариф для доступа.
Перейти на платный тарифTranscripts

Этот раздел доступен только подписчикам платных тарифов. Пожалуйста, перейдите на платный тариф для доступа.
Перейти на платный тарифПосмотреть больше похожих видео

Belajar Statistika - Fase F - Analisis Data Bivariat (bagian 1) - Korelasi #merdekabelajar
Bivariate Analysis for Categorical & Numerical | Statistics Tutorial #20 | MarinStatsLectures

KULIAH STATISTIK - ANALISIS KORELASI

Statistika Bivariat: Mengungkap Hubungan Dua Variabel!
Cálculo del coeficiente de correlación r | Khan Academy en Español
VIDEO 3 Jenis uji statistik AWAL
5.0 / 5 (0 votes)
