Raspberry Pi Anemometer: Measuring Wind Speed!
Summary
TLDRIn this video, the creator builds a homemade anemometer to measure wind speed as part of a Raspberry Pi weather station project. Using low-cost components like ping-pong balls, an infrared sensor, and a Raspberry Pi, the video walks through the assembly, wiring, and coding process. The goal is to track wind speed alongside temperature, pressure, and humidity data. The project introduces key concepts in electronics, Python programming, and sensor integration. The creator hints at future plans to expand the weather station and explore plant cultivation monitoring using Raspberry Pi sensors.
Takeaways
- 😀 The video is a tutorial on building a homemade anemometer to measure wind speed and integrate it with a Raspberry Pi weather station.
- 🛠 The project uses a Raspberry Pi 3 B+, but any model can be used. An infrared reflectance sensor is employed to detect rotation.
- 💡 The anemometer is constructed with simple materials like ping-pong balls, a biro, M3 nuts and bolts, and a high-impact polystyrene sheet.
- 🔍 The infrared sensor works by emitting infrared light that reflects off a surface and is detected by a phototransistor.
- 📏 The anemometer's design includes a black disc with a white mark to enable the sensor to track rotation.
- 💻 The video demonstrates writing Python code to process the sensor's input and calculate the wind speed.
- 🔢 The code accounts for the anemometer's efficiency by using a factor to adjust the final wind speed calculation.
- 📈 Data including temperature, pressure, humidity, and wind speed is recorded and can be exported to a spreadsheet.
- 🌤️ The anemometer was tested both indoors with artificial wind and outdoors in a garden, showing variable results with real weather conditions.
- 🌱 The creator plans to expand the project by adding more sensors and exploring Raspberry Pi applications in plant cultivation and monitoring.
Q & A
What is the purpose of the video?
-The purpose of the video is to demonstrate how to build a low-cost homemade anemometer using a Raspberry Pi to measure wind speed and integrate it into an existing Raspberry Pi weather station project.
What is an anemometer, and how does it work in this project?
-An anemometer is a device used to measure wind speed. In this project, the anemometer is constructed using ping-pong balls, a biro, and a sensor. The wind spins the device, and the Raspberry Pi records the number of rotations using an infrared reflectance sensor to calculate wind speed.
Which Raspberry Pi model is used in the project?
-The project uses a Raspberry Pi 3 B+, but the creator mentions that any model of Raspberry Pi can be used.
What is the role of the infrared reflectance sensor in this project?
-The infrared reflectance sensor is used to measure the rotation of the anemometer. It detects the reflection of a white mark on a rotating disc attached to the anemometer, allowing the Raspberry Pi to count the number of rotations.
What materials are used to construct the anemometer?
-The materials used include ping-pong balls (cut in half to create cups), a biro (for the axle), m3 nuts and bolts, a high-impact polystyrene sheet, liquid polystyrene adhesive, and a black disc with a white mark for rotation detection.
How is wind speed calculated using the anemometer?
-Wind speed is calculated by measuring the number of rotations of the anemometer in a set period, determining the distance traveled by the wind based on the circumference of the rotating cups, and applying an anemometer factor to account for inefficiencies in the measurement process.
What coding languages and libraries are used in the project?
-The project uses Python for coding. Libraries such as the GPIO library are used to interact with the Raspberry Pi's pins, and additional libraries handle timing and sensor inputs.
What is the purpose of the 'anemometer factor' in the wind speed calculation?
-The anemometer factor is a multiplier used to account for inefficiencies in the anemometer's operation, such as friction and energy loss. The factor is estimated based on the design and efficiency of the specific anemometer.
How does the Raspberry Pi record the weather data?
-The Raspberry Pi runs Python code that collects data from the anemometer (wind speed) and a BME280 sensor (temperature, pressure, humidity). This data is recorded in a spreadsheet every 10 minutes.
What future plans does the creator have for this Raspberry Pi weather station project?
-The creator plans to add more sensors to the weather station and explore using the Raspberry Pi to control and monitor plant cultivation in a greenhouse.
Outlines

Этот раздел доступен только подписчикам платных тарифов. Пожалуйста, перейдите на платный тариф для доступа.
Перейти на платный тарифMindmap

Этот раздел доступен только подписчикам платных тарифов. Пожалуйста, перейдите на платный тариф для доступа.
Перейти на платный тарифKeywords

Этот раздел доступен только подписчикам платных тарифов. Пожалуйста, перейдите на платный тариф для доступа.
Перейти на платный тарифHighlights

Этот раздел доступен только подписчикам платных тарифов. Пожалуйста, перейдите на платный тариф для доступа.
Перейти на платный тарифTranscripts

Этот раздел доступен только подписчикам платных тарифов. Пожалуйста, перейдите на платный тариф для доступа.
Перейти на платный тарифПосмотреть больше похожих видео
Raspberry Pi Weather Station

Using Ollama to Run Local LLMs on the Raspberry Pi 5
The ULTIMATE Raspberry Pi 5 NAS

Raspberry Pi Pico Project - Thermometer & Clock ST7735 & DS3231

Blinking LED Raspberry Pi Tutorial
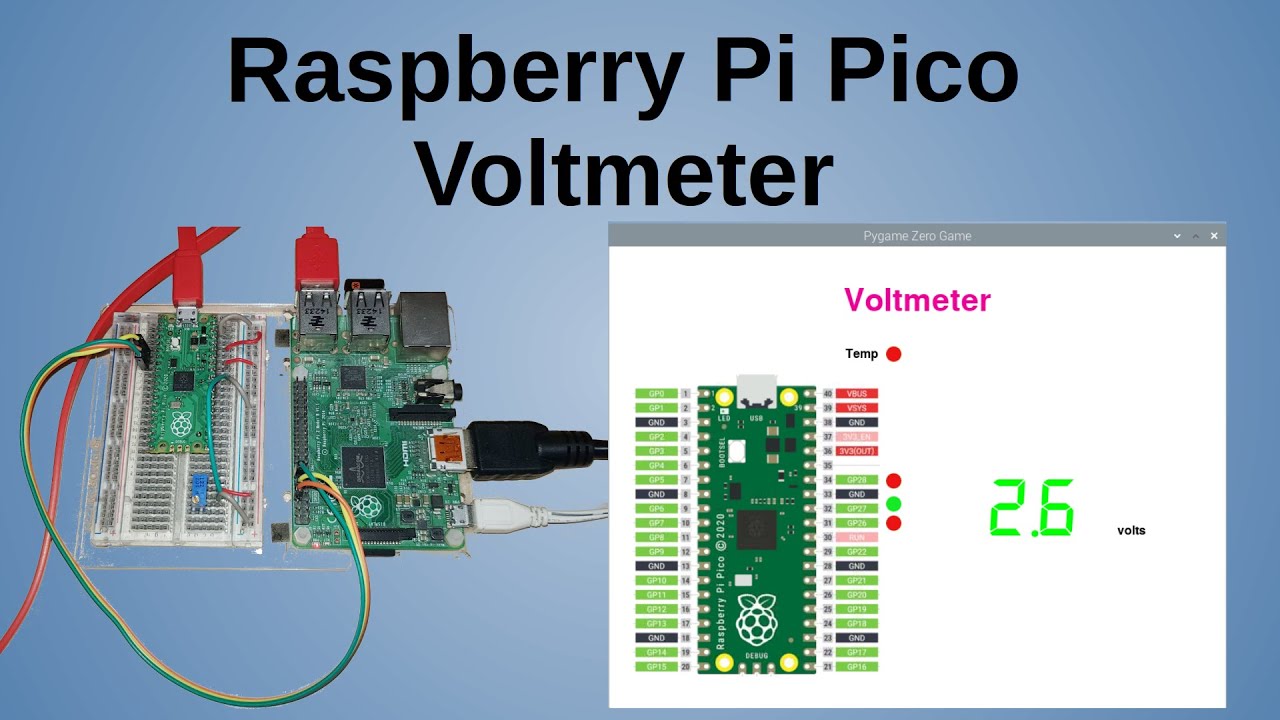
Raspberry Pi Pico Voltmeter - UART serial with the Pico and GUI application in C/C++ and MicroPython
5.0 / 5 (0 votes)
