Raspberry Pi Weather Station
Summary
TLDRThis video tutorial demonstrates how to transform a Raspberry Pi into a functional weather station using a Bosch BME 280 sensor. The host guides viewers through the process of setting up the sensor, installing necessary libraries, and writing Python code to collect temperature, pressure, and humidity data. The video also addresses common issues like sensor inaccuracies due to heat from the Raspberry Pi and shows how to record and analyze the collected data over time using LibreOffice Calc, with the ultimate goal of monitoring and potentially predicting weather patterns.
Takeaways
- 😀 The video is about converting a Raspberry Pi into a weather station using a Bosch BME 280 sensor.
- 🛠️ The sensor hardware is mounted on a breakout board from Pimoroni and costs £12.60.
- 🔍 The BME 280 sensor provides temperature, pressure, and humidity sensing and is supported by a Python library and sample code.
- 🔗 Links to the data sheet and GitHub repository for the sensor are provided for further information and examples.
- 🔧 Wiring the sensor to a Raspberry Pi involves soldering female right-angle headers or using jumper leads to extend the sensor away from the Pi.
- 📦 The video mentions an alternative BME 280 module from Adafruit with different wiring but the same implementation and operation.
- 🔄 To enable sensor access on Raspberry Pi OS, the I²C serial communications interface must be enabled and specific libraries installed via terminal commands.
- 💻 The sample code provided by Pimoroni is used to read and display sensor data, with initial issues resolved by discarding the first incorrect reading.
- 🌡️ The video discusses a common issue with sensor temperature readings being skewed due to heat from the Raspberry Pi's system on a chip, and how to mitigate it.
- 📝 The video demonstrates how to modify the code to record weather data over time using LibreOffice Calc and append readings to a spreadsheet.
- 🔒 Enabling SSH on the Raspberry Pi allows for remote access and execution of the weather data collection script from a laptop or other devices.
Q & A
What is the purpose of the video?
-The purpose of the video is to demonstrate how to turn a Raspberry Pi into a weather station using a temperature, pressure, and humidity sensor.
Which sensor is used in the video to create the weather station?
-The sensor used is based on the Bosch BME 280, mounted on a breakout board from Pymironi.
What is the cost of the sensor hardware mentioned in the video?
-The sensor hardware, which includes the sensor and two 5-pin headers, is priced at 12 pounds 60.
What is the physical size of the BME 280 component?
-The BME 280 component is very small, approximately 2.5 millimeters square.
What is provided on the board's webpage to support the sensor?
-The board's webpage provides a Python library for the board, sample code, and a link to the data sheet for the BME 280 module from Bosch.
Is there an alternative module for the BME 280 sensor?
-Yes, a slightly different module for the BME 280 sensor is available from Adafruit for 14.95, which would require slightly different wiring.
How is the sensor connected to the Raspberry Pi in the video?
-The sensor is soldered with a female right-angle header directly onto the sensor board and then connected to the Raspberry Pi's GPIO pins.
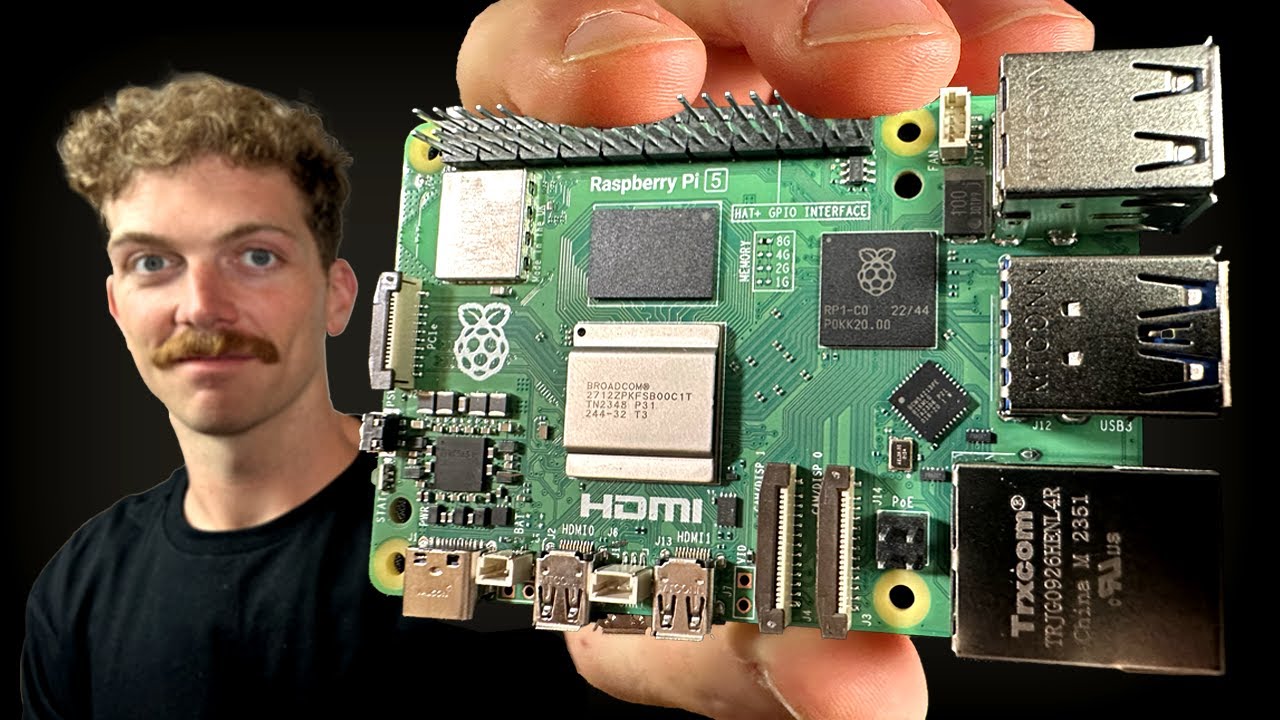
What Raspberry Pi model is used in the video?
-A Raspberry Pi 3 Model B Plus is used in the video, but any model of Raspberry Pi can be used for the weather station project.
What command is used in the video to install necessary libraries for the BME 280 module?
-The command used is 'sudo pip install' to install the primary BME 280 module library and the SMBus library.
What issue occurs with the first reading from the sensor?
-The first reading from the sensor is often incorrect, which the video suggests is due to the sensor warming up.
How is the incorrect temperature reading issue resolved in the video?
-The issue is resolved by separating the sensor from the GPIO connectors to prevent the Raspberry Pi's system on a chip from warming the sensor and giving incorrect readings.
How is the Raspberry Pi set up to be accessed remotely in the video?
-SSH is enabled on the Raspberry Pi, and the default password is changed for security. The video also demonstrates using an SSH client like PuTTY to access the Pi remotely.
What software is used in the video to create a spreadsheet for recording weather data?
-LibreOffice Calc is used to create and manipulate the spreadsheet for recording weather data.
How frequently are the weather data readings taken in the final setup of the video?
-The weather data readings are taken every 10 minutes in the final setup.
What is the final outcome of the experiment shown in the video?
-The final outcome is that the Raspberry Pi successfully collects real weather data, which can be used to monitor and potentially predict weather conditions.
Outlines

This section is available to paid users only. Please upgrade to access this part.
Upgrade NowMindmap

This section is available to paid users only. Please upgrade to access this part.
Upgrade NowKeywords

This section is available to paid users only. Please upgrade to access this part.
Upgrade NowHighlights

This section is available to paid users only. Please upgrade to access this part.
Upgrade NowTranscripts

This section is available to paid users only. Please upgrade to access this part.
Upgrade Now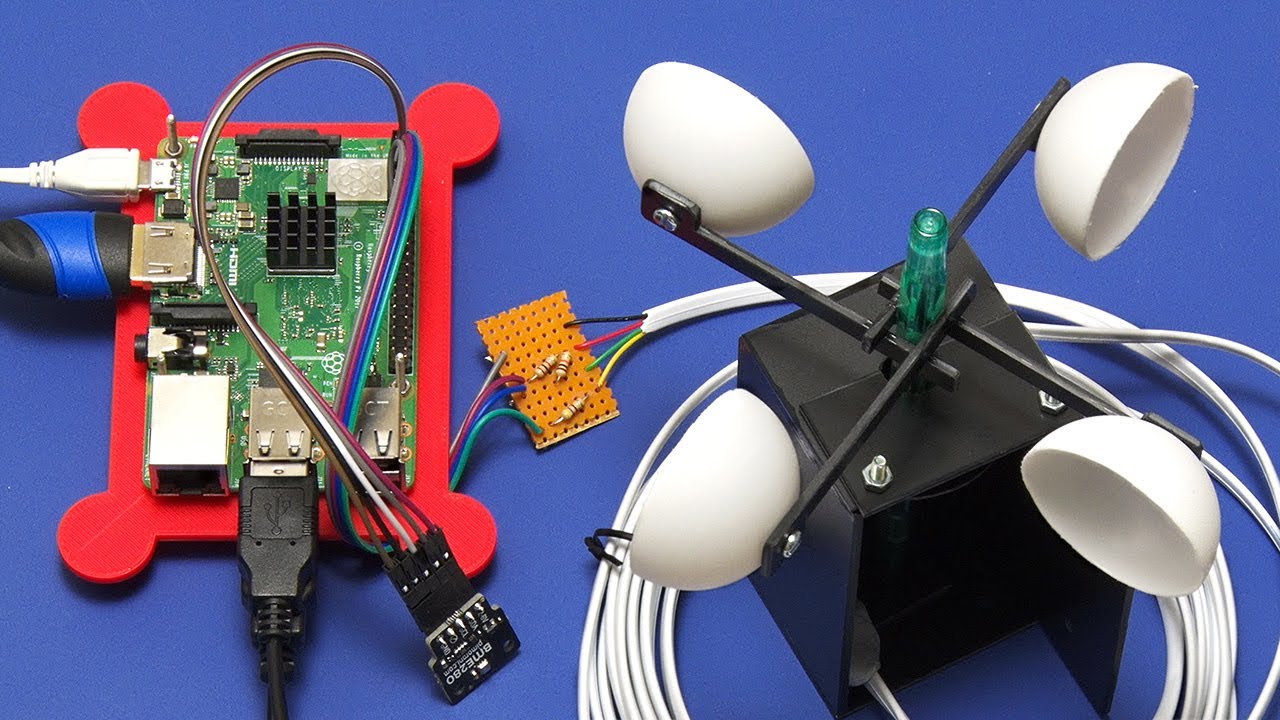


5.0 / 5 (0 votes)