Central Limit Theorem & Sampling Distribution Concepts | Statistics Tutorial | MarinStatsLectures

MarinStatsLectures-R Programming & Statistics
28 Jun 201807:55

Summary

TLDRThis video explores the concept of the sampling distribution, particularly the sampling distribution of the mean. It explains how knowing the true mean of a population can help predict the likelihood of certain sample means appearing when collecting data. The video uses the example of systolic blood pressure to illustrate how repeated sampling of 25 observations can lead to a normal distribution of sample means around the true mean. It introduces the central limit theorem and discusses the standard error of the mean, which indicates how closely sample means are likely to approximate the true mean. The video concludes by emphasizing the importance of these concepts for statistical inference, including constructing confidence intervals and hypothesis tests.

Takeaways

  • 📊 **Sampling Distribution Concept**: The video introduces the concept of a sampling distribution, focusing on the distribution of sample means.
  • 🔍 **Understanding Population Truth**: It discusses how knowing the true mean and standard deviation of a population can help predict sample means.
  • 🌐 **Central Limit Theorem**: Explains the central limit theorem, which states that the sampling distribution of the mean will be normal if samples are large or the population distribution is normal.
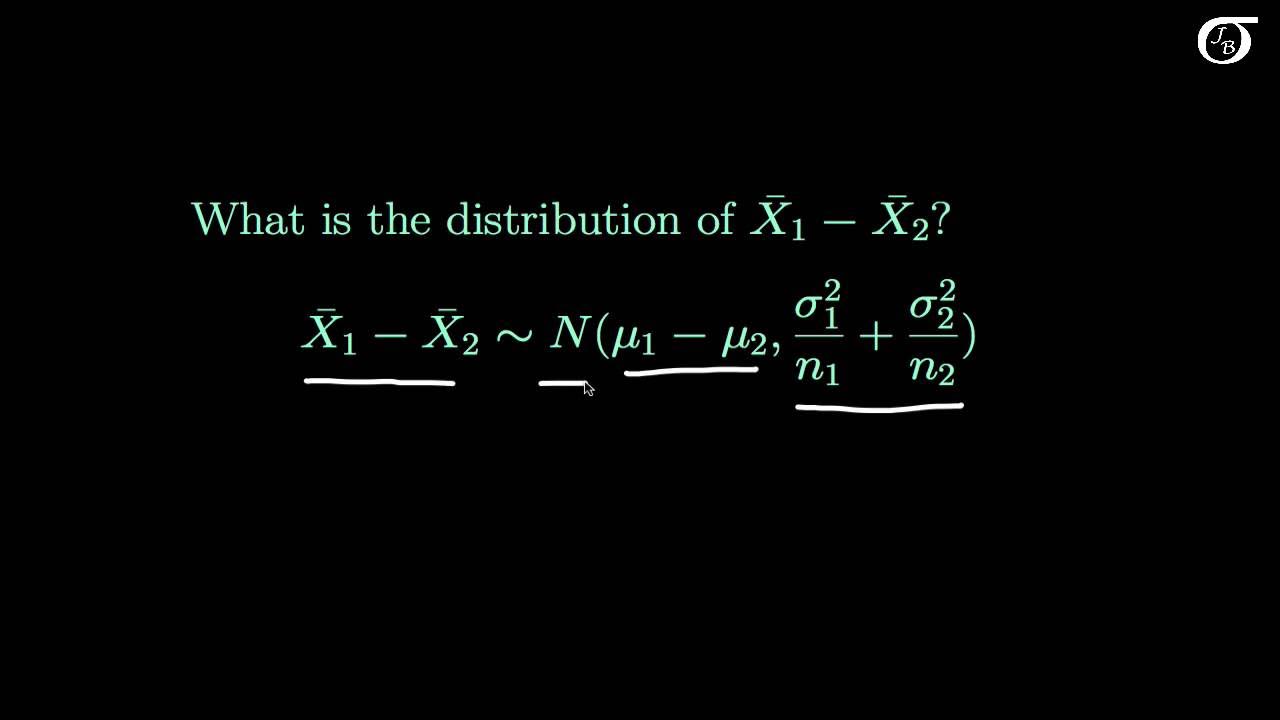
  • 📐 **Standard Error of the Mean**: Introduces the standard error of the mean, which is the standard deviation of the sample mean.
  • 🔢 **Calculating Standard Error**: Shows how to calculate the standard error as the population standard deviation divided by the square root of the sample size.
  • 🎯 **Expectation of Sample Mean**: Emphasizes that while we expect the sample mean to equal the true mean, it will vary.
  • 📉 **Distribution of Sample Means**: Highlights that the distribution of sample means is centered around the true mean and is approximately bell-shaped.
  • 📈 **Impact of Sample Size**: Notes that as sample size increases, the standard error decreases, making estimates more precise.
  • 🔄 **Repeated Sampling**: Suggests imagining taking multiple samples to understand the variability in sample means.
  • 🔗 **Interactive Learning**: Encourages viewers to use web visualizations for a more interactive understanding of sampling distributions.
  • 📚 **Application in Statistics**: Mentions that understanding sampling distributions is crucial for statistical inference, including confidence intervals and hypothesis testing.

Q & A

  • What is a sampling distribution?

    -A sampling distribution is the theoretical set of all possible estimates or sample means that could be obtained from a population by taking many samples of a given size.

  • Why is understanding the sampling distribution important?

    -Understanding the sampling distribution is crucial for statistical inference, as it allows us to make statements about a population based on a sample and to estimate how likely certain sample means are to occur.

  • What is the central limit theorem and how does it relate to sampling distribution?

    -The central limit theorem states that if samples are independent and the sample size is large enough, or the population distribution is approximately normal, then the sampling distribution of the sample mean will be approximately normal.

  • What is the true mean and standard deviation of the systolic blood pressure in the example given?

    -In the example provided, the true mean of the systolic blood pressure is 125, and the true standard deviation is 20.

  • What is the sample size used in the example?

    -The sample size used in the example is 25 observations.

  • What is the standard error of the mean and how is it calculated?

    -The standard error of the mean is the standard deviation of all possible sample means and is calculated as the standard deviation of the individual observations divided by the square root of the sample size (20 / √25 = 4 in the example).

  • How does the standard error help in understanding the sampling distribution?

    -The standard error provides an idea of how far, on average, the sample mean will deviate from the true mean, indicating how close our estimates are likely to be to the true value.

  • What happens to the standard error as the sample size increases?

    -As the sample size increases, the standard error decreases, meaning that our estimates become closer to the true values as we take more data.

  • What is the significance of the sample mean being approximately normally distributed?

    -The fact that the sample mean is approximately normally distributed allows us to use the properties of the normal distribution to make inferences about the population mean, such as constructing confidence intervals and conducting hypothesis tests.

  • How can the concept of the sampling distribution be explored interactively?

    -The concept of the sampling distribution can be explored interactively through web visualizations, as mentioned in the script, where one can simulate taking multiple samples and observe the resulting distributions.

  • What are the practical applications of understanding the sampling distribution in statistics?

    -Understanding the sampling distribution is essential for statistical inference, including building confidence intervals and conducting hypothesis tests, which help in making informed decisions based on sample data.

Outlines

00:00

📊 Building the Concept of Sampling Distribution

This paragraph introduces the concept of a sampling distribution, specifically focusing on the sampling distribution of the mean. It explains how understanding the sampling distribution helps in statistical inference, where one uses a sample to make statements about the population. The video uses a hypothetical scenario where the true mean and standard deviation of systolic blood pressure in a population are known. It then illustrates the idea of taking multiple samples of size 25 from this population to build the sampling distribution. The central limit theorem is mentioned, which states that if samples are independent and the sample size is large or the distribution of individuals is normal, then the sampling distribution of the mean will be approximately normal. The paragraph concludes by discussing the standard error of the mean, which is the standard deviation of the sample means and gives an idea of how far the sample mean is likely to deviate from the true mean on average.

05:00

🔍 Understanding the Standard Error and Its Implications

The second paragraph delves deeper into the concept of the standard error of the mean, explaining its role in understanding how estimates from samples deviate from the true population mean. It emphasizes that while we expect our sample mean to equal the true mean, it will likely vary slightly. The standard error provides an average measure of this deviation, indicating how close our estimates are likely to be to the true value. As the sample size increases, the standard error decreases, meaning our estimates become more precise. The paragraph suggests that this understanding is crucial for statistical inference, where one uses sample data to make inferences about the population. The video also encourages viewers to interact with a web visualization for a more hands-on experience and hints at upcoming discussions on confidence intervals and hypothesis testing.

Mindmap

Keywords

💡Sampling Distribution

The sampling distribution refers to the theoretical distribution of a statistic (such as the sample mean) that would result from taking many samples of a given size from a population. In the video, the concept is used to illustrate how the distribution of sample means can be understood if we repeatedly sample from a population with a known true mean and standard deviation. The video explains that in reality, we only take one sample, but for the sake of understanding, we consider it as one of many possible samples.

💡Sample Mean

The sample mean is the average value of a sample drawn from a population. It is used as an estimate of the population mean. The video script discusses how we can take a sample of 25 observations and calculate a sample mean, which is one of many possible sample means we could get if we were to take multiple samples.

💡Population Mean

The population mean is the average value of all the members of a population. The video uses the example of systolic blood pressure, where the true population mean is given as 125. This is the value that the sample mean is expected to approximate when taking repeated samples.

💡Standard Deviation

Standard deviation is a measure of the amount of variation or dispersion in a set of values. In the context of the video, it is used to describe the true standard deviation of the systolic blood pressure distribution in the population, which is stated to be 20.

💡Central Limit Theorem

The central limit theorem is a fundamental principle in statistics that states that the sampling distribution of the sample mean will be approximately normally distributed if the sample size is large enough, regardless of the shape of the population distribution. The video explains that if we take samples of a certain size (25 in the example) from a population, the distribution of these sample means will be approximately normal.

💡Standard Error of the Mean

The standard error of the mean (often abbreviated as SEM) is the standard deviation of the sample mean. It is a measure of how much variability or 'spread' exists in the sample mean over all possible samples of a given size. The video explains that the standard error is calculated as the population standard deviation divided by the square root of the sample size, which in the example is 20 divided by the square root of 25, resulting in 4.

💡Statistical Inference

Statistical inference is the process of drawing conclusions about a population from a sample. The video script discusses how understanding the sampling distribution allows us to make inferences about the population. For instance, if we know the true mean and standard deviation of the population, we can use the sample mean to make statements about the population.

💡Confidence Interval

A confidence interval is a range within which we expect the true population parameter to lie with a certain level of confidence. The video script alludes to the use of the sampling distribution to build a confidence interval, which is a way to express the uncertainty of the estimate of the population parameter.

💡Hypothesis Testing

Hypothesis testing is a statistical method used to make decisions about a population parameter based on sample data. The video mentions that the concept of the sampling distribution will be used in future discussions to build up hypothesis tests, which are used to determine if there is a significant difference between the sample data and the hypothesized population parameter.

💡Normal Distribution

A normal distribution, also known as a Gaussian distribution, is a continuous probability distribution that is symmetric about the mean, showing that data near the mean are more frequent in occurrence than data far from the mean. The video explains that according to the central limit theorem, the sampling distribution of the sample mean will be approximately normally distributed, which is key to understanding how sample means vary around the true mean.

Highlights

Introduction to the concept of a sampling distribution

Explanation of sampling distribution of the mean

Importance of understanding sampling distribution for statistical inference

Conceptualizing the sampling distribution as a set of all possible sample means

Central Limit Theorem's role in sampling distribution

Expectation of the sample mean to equal the true mean

Understanding that sample means will vary around the true mean

Definition and calculation of the standard error of the mean

Standard error as a measure of the average deviation of the sample mean from the true mean

The normal distribution of sample means around the true mean

Implications of the standard error for statistical inference

How the standard error decreases as sample size increases

Practical applications of the standard error in statistical inference

The impact of larger sample sizes on the accuracy of estimates

Interactive web visualizations for exploring sampling distribution concepts

Upcoming topics on building confidence intervals and hypothesis tests

Encouragement for viewers to engage with the content and the channel

Transcripts

play00:00

in this video we're going to build up

play00:01

the concept of a sampling distribution

play00:03

and specifically we're going to talk

play00:05

about the sampling distribution of the

play00:07

meat this is going to help us to

play00:09

understand if we knew the truth for the

play00:11

entire population how likely are certain

play00:14

things to show up when we collect a

play00:16

sample of data specifically if we knew

play00:18

the true mean in the population how

play00:20

likely are certain sample means to show

play00:22

up when we collect some data building

play00:24

this understanding is going to help us

play00:26

to do statistical inference where we

play00:28

take our sample and try and make

play00:30

statements about the population

play00:32

so first let's build up these concepts

play00:35

here so to do this we're going to live

play00:38

in the pretend world for a little bit

play00:39

and we're in suppose that we know at the

play00:42

population level

play00:43

systolic blood pressure has a

play00:45

distribution that's skewed to the right

play00:47

we know the true means 125 the true

play00:50

standard deviation is 20 and we're going

play00:53

to reach into this population here we're

play00:56

going to take a sample of 25

play00:58

observations and we're going to

play01:00

calculate a sample mean now in reality

play01:03

we're just going to take one sample of

play01:05

size 25 and get one sample mean but we

play01:09

learned to think of this sample mean

play01:11

here as one of many we could have got

play01:13

and we could have ended up with a

play01:16

slightly different set of data which we

play01:17

would get which would have given us a

play01:19

different estimate so this builds the

play01:22

idea of a sampling distribution and the

play01:27

sampling distribution is the theoretical

play01:30

set of all possible estimates or sample

play01:42

means we could get okay again in reality

play01:47

we only end up with 1 but we think of it

play01:49

as one of many we could have possibly

play01:51

got ok so to build up this concept we're

play01:54

going to imagine taking samples of size

play01:56

25 over and over again from this

play01:58

population and looking at the

play02:00

distribution or the set of all the

play02:03

possible estimates we could have got so

play02:05

we have this idea of the central limit

play02:07

theorem which basically tells us if the

play02:11

individuals we take that we sample from

play02:13

the pot

play02:14

relation are independent and we take a

play02:17

either a large sample size or the

play02:20

distribution of the individuals is

play02:22

approximately normal then the sampling

play02:25

distribution okay this theoretical set

play02:27

of all the estimates we could have ended

play02:28

up with will be approximately normal so

play02:33

we can think of when we collect our

play02:35

sample of 25 observations we expect and

play02:40

expect in the statistical sense we

play02:43

expect that our sample mean is going to

play02:46

be equal to the true mean of 125 but we

play02:49

know that it won't so again the

play02:52

statistical meaning of us expect on

play02:54

average if we took repeated samples over

play02:57

and over the mean of all the sample

play03:00

means would be 125 similar to the idea

play03:02

of if you toss a coin 100 times you

play03:05

expect to get 50 heads chances are you

play03:08

won't so we expect our sample mean to be

play03:11

equal to the true mean we know that it

play03:13

won't be we might get something a little

play03:15

bit above or a little bit below but if

play03:18

we took samples over and over again and

play03:20

calculated sample means over and over

play03:22

again and looked at the distribution and

play03:24

your histogram all these it would be

play03:27

approximately bell-shaped centered

play03:30

around the true mean we can think of the

play03:34

standard deviation of all these possible

play03:37

sample means that we can get we call

play03:40

that the standard deviation of X bar

play03:44

or often once we move into dealing with

play03:46

only samples of data we're gonna call it

play03:48

the standard error of the mean standard

play03:51

deviation of the mean standard error the

play03:52

mean exact same concept without any

play03:57

justification for the moment this comes

play03:59

out to be the standard deviation of the

play04:01

individual observations divided by the

play04:04

square root of the sample size here 20

play04:08

over square root of 25 which equals 4

play04:12

Gideon later we can talk about

play04:14

mathematically how do we get ourselves

play04:15

there but what this standard error tells

play04:18

us is that while we expect our sample

play04:20

mean to be equal to the true mean of 125

play04:22

we know that it won't it's going to vary

play04:25

a bit above or below but this standard

play04:28

deviation of the mean gives us an idea

play04:30

of on average how far will our estimate

play04:33

move from the true value so on average

play04:35

our sample mean is going to move about 4

play04:37

units from that true mean we also know

play04:41

that it's going to be normally

play04:42

distributed or symmetrically distributed

play04:44

around the true mean so again to recap

play04:47

some of these ideas we're going to reach

play04:49

into the population we're going to

play04:51

select 25 individuals and for them we're

play04:54

going to calculate a sample mean okay

play04:55

we're only gonna do this once but we can

play04:57

think of it as one of many estimates we

play05:00

could have possibly got we're going to

play05:02

expect our estimate to be equal to the

play05:04

true value we know that it won't be

play05:06

right might vary a bit above or a bit

play05:08

below but the sample mean varies

play05:15

according to a normal distribution

play05:23

meaning is

play05:25

symmetrically distributed around the

play05:27

true value and again the standard error

play05:29

gives us an idea of on average how far

play05:32

will our estimate move from the true

play05:34

value another way to think of this the

play05:37

standard deviation of the mean or what

play05:38

we're going to start called a standard

play05:39

error let's write it down because this

play05:42

is important this gives us an idea of on

play05:46

average how far will our estimate the

play05:53

sample mean move okay or deviate from

play05:58

the true value you if we reverse the way

play06:06

we're thinking about it we can think of

play06:08

it this tells us on average how close

play06:10

will our estimate be to the true value

play06:13

okay so again well right now we're in

play06:16

this pretend world we can see getting

play06:18

this idea of a standard deviation of the

play06:20

mean or standard error is going to give

play06:22

us an idea on average how far or how

play06:26

close is our estimate to the true mean

play06:28

we're going to use this when we start to

play06:31

move into statistical inference and

play06:32

having to take our sample and try and

play06:35

make statements about the population

play06:37

this is going to help us understand how

play06:39

far estimates tend to move from the true

play06:41

values or how close true values tend to

play06:44

be to the estimates one final note

play06:47

before we stop here is just to take note

play06:49

of what happens to the standard

play06:53

deviation of the mean carry the standard

play06:55

error as n our sample size becomes

play06:57

larger and larger right we can notice as

play06:59

our sample size becomes bigger and

play07:01

bigger the standard deviation of the

play07:03

mean or the standard error is going to

play07:04

come smaller and smaller and again

play07:06

hopefully this makes intuitive sense as

play07:08

we take more and more data our estimates

play07:11

should be closer and closer to the true

play07:13

values you can take a look at the web

play07:16

visualization that we link to in the

play07:19

video description below to play around

play07:21

with this concept a bit more

play07:22

interactively and in following videos

play07:25

we're going to start to see how we can

play07:26

use ok this idea of a sampling

play07:28

distribution to do statistical inference

play07:31

namely to build a confidence interval or

play07:34

to start to build up hypothesis test

play07:36

thanks for watching Eric

play07:37

you suscribe to our channel like our

play07:41

videos share videos

play07:44

I love statistics statistics is hard to

play07:48

say couponing and all summed up over you

Rate This

5.0 / 5 (0 votes)

Связанные теги
Sampling DistributionStatistical InferenceCentral Limit TheoremSample MeanPopulation MeanStandard ErrorData AnalysisStatistical ConceptsBlood PressureStatistical Learning
Вам нужно краткое изложение на английском?