Z-Scores, Standardization, and the Standard Normal Distribution (5.3)
Summary
TLDRThis video script offers an insightful exploration of z-scores and the standardization process in statistics. It explains the concept of the standard normal distribution, a bell curve with a mean of 0 and a standard deviation of 1. The script delves into how to calculate exact proportions using this distribution and z-score tables, illustrating the process with examples. It also highlights the benefits of standardization, allowing for the conversion of any normal distribution into the standard form, and demonstrates how to apply this to calculate specific areas under the curve, providing a practical understanding of statistical analysis.
Takeaways
- 📊 The standard normal distribution is a type of normal distribution with a mean of 0 and a standard deviation of 1.
- 🧮 A z-score represents how many standard deviations an observation is from the mean.
- 📉 A negative z-score indicates that the observation is below the mean, while a positive z-score indicates it's above the mean.
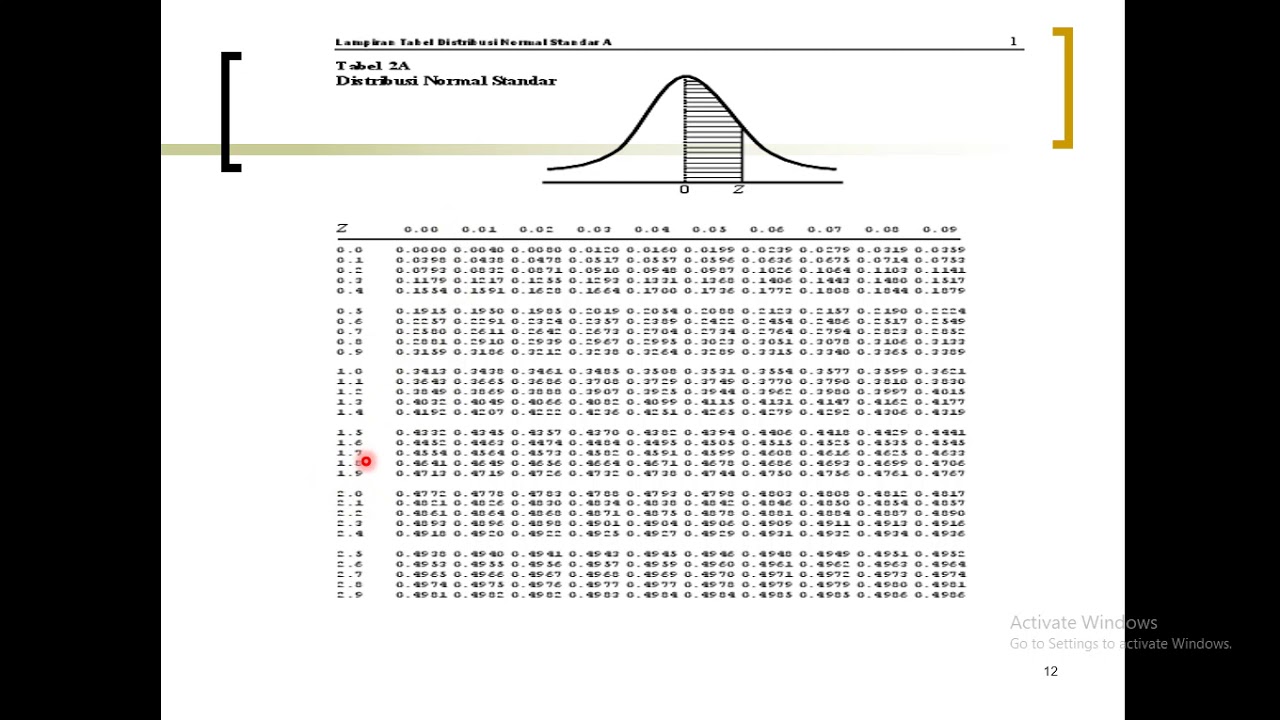
- 📑 The z-score table (standard normal table) helps to calculate the area (proportion) to the left of any z-score.
- 🔄 To find the area to the right of a z-score, subtract the table value from 1.
- 🔍 The z-score table can also be used for reverse look-ups to find the z-score associated with a specific area.
- 🔄 Any normal distribution can be standardized, converting it to a standard normal distribution with a mean of 0 and a standard deviation of 1.
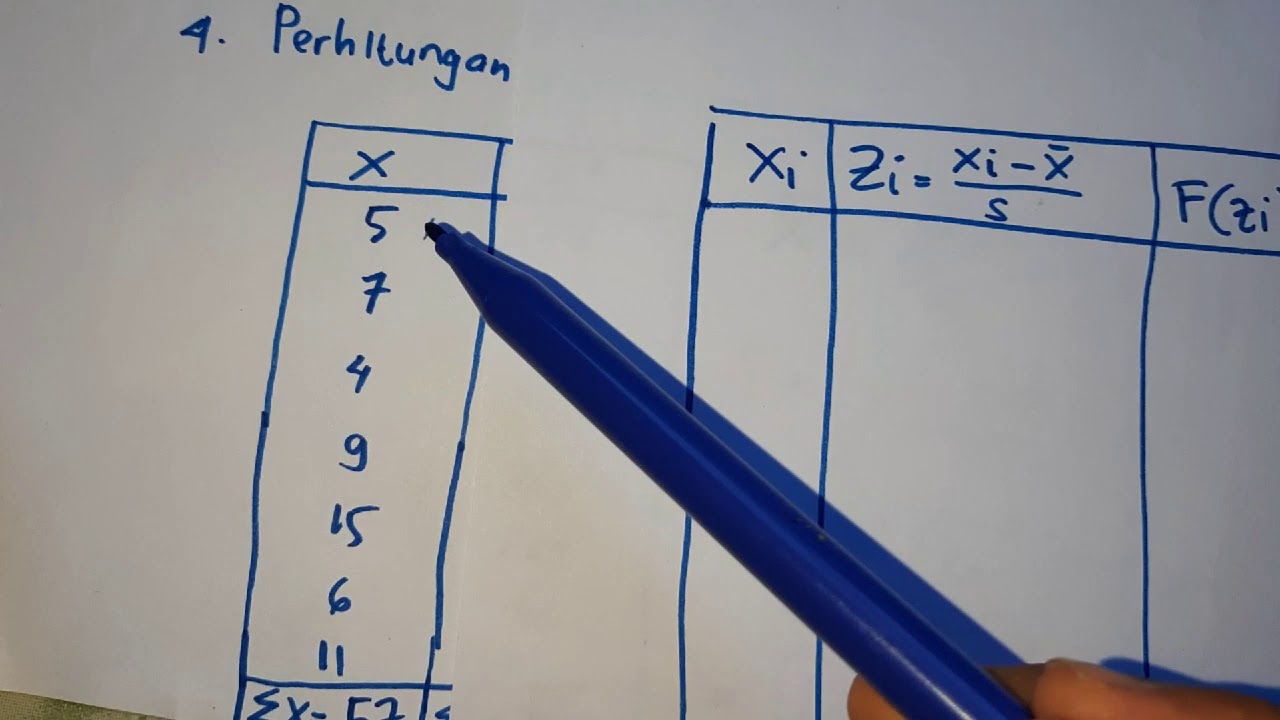
- 🧪 The formula for standardization is z = (X - μ) / σ, where X is the observation, μ is the mean, and σ is the standard deviation.
- 📏 Standardization allows you to use the z-score table to calculate areas for any normally distributed population.
- 📐 The proportion of values within a specific range can be calculated by finding the z-scores of the range limits and then subtracting the corresponding areas.
Q & A
What is a standard normal distribution?
-A standard normal distribution is a special type of normal distribution with a mean of 0 and a standard deviation of 1. It is always centered at 0, and each number on the horizontal axis corresponds to a z-score, which indicates how many standard deviations an observation is from the mean.
What does a z-score represent?
-A z-score represents the number of standard deviations an observation is from the mean (mu). For example, a z-score of -2 indicates that the observation is 2 standard deviations below the mean, while a z-score of 1.5 indicates it is 1.5 standard deviations above the mean.
How can we find the exact area associated with a specific z-score?
-We can find the exact area associated with a specific z-score using a z-score table, also known as the standard normal table. This table provides the total amount of area contained to the left side of any z-value.
What is the proportion of Z less than -1.95 according to the standard normal table?
-According to the standard normal table, the proportion of Z less than -1.95 is 0.0256. This means there is 2.56% of the area to the left of a z-score of -1.95.
How do we determine the area to the right of a z-score?
-To determine the area to the right of a z-score, we find the area that corresponds to that z-value in the standard normal table and then subtract it from 1. For example, to find the area to the right of a z-score of 0.57, we subtract the area of 0.7157 (to the left of 0.57) from 1, resulting in an area of 0.2843.
What is the purpose of using a z-score table for reverse look-up?
-The purpose of using a z-score table for reverse look-up is to determine what z-score corresponds to a specific area. For instance, if you want to know what z-score is associated with an area of 0.8446 to the left of it, you find 0.8446 on the table and see the corresponding z-score, which is 1.02.
What is the process of standardization in the context of normal distributions?
-Standardization is the process of converting any normal distribution with any mean (mu) and standard deviation (sigma) into the standard normal distribution, where the mean is zero and the standard deviation is one. This allows the use of the z-score table to calculate exact areas for any given normally distributed population.
What is the standardization formula used to convert a normal distribution to a standard normal distribution?
-The standardization formula is Z = (X - mu) / sigma, where Z is the z-score, X is the observation, mu is the population mean, and sigma is the population standard deviation.
How can we find the proportion of students scoring less than 49 on an exam with a mean of 60 and a standard deviation of 10?
-First, we standardize the distribution using the formula Z = (X - mu) / sigma. For X = 49, the z-score is -1.1. Then, we look up the z-score of -1.1 in the standard normal table to find the proportion of Z less than -1.1, which is 0.1357. This is the proportion of students scoring less than 49.
What proportion of students are between 5.81 feet and 6.3 feet tall if the height distribution has a mean of 5.5 feet and a standard deviation of 0.5 feet?
-We standardize the distribution to find the z-scores for 5.81 feet (z = 0.62) and 6.3 feet (z = 1.6). Then, we subtract the area corresponding to z = 0.62 (0.7304) from the area corresponding to z = 1.6 (0.9452), resulting in a proportion of 0.2148, or 21.48% of students.
Outlines

このセクションは有料ユーザー限定です。 アクセスするには、アップグレードをお願いします。
今すぐアップグレードMindmap

このセクションは有料ユーザー限定です。 アクセスするには、アップグレードをお願いします。
今すぐアップグレードKeywords

このセクションは有料ユーザー限定です。 アクセスするには、アップグレードをお願いします。
今すぐアップグレードHighlights

このセクションは有料ユーザー限定です。 アクセスするには、アップグレードをお願いします。
今すぐアップグレードTranscripts

このセクションは有料ユーザー限定です。 アクセスするには、アップグレードをお願いします。
今すぐアップグレード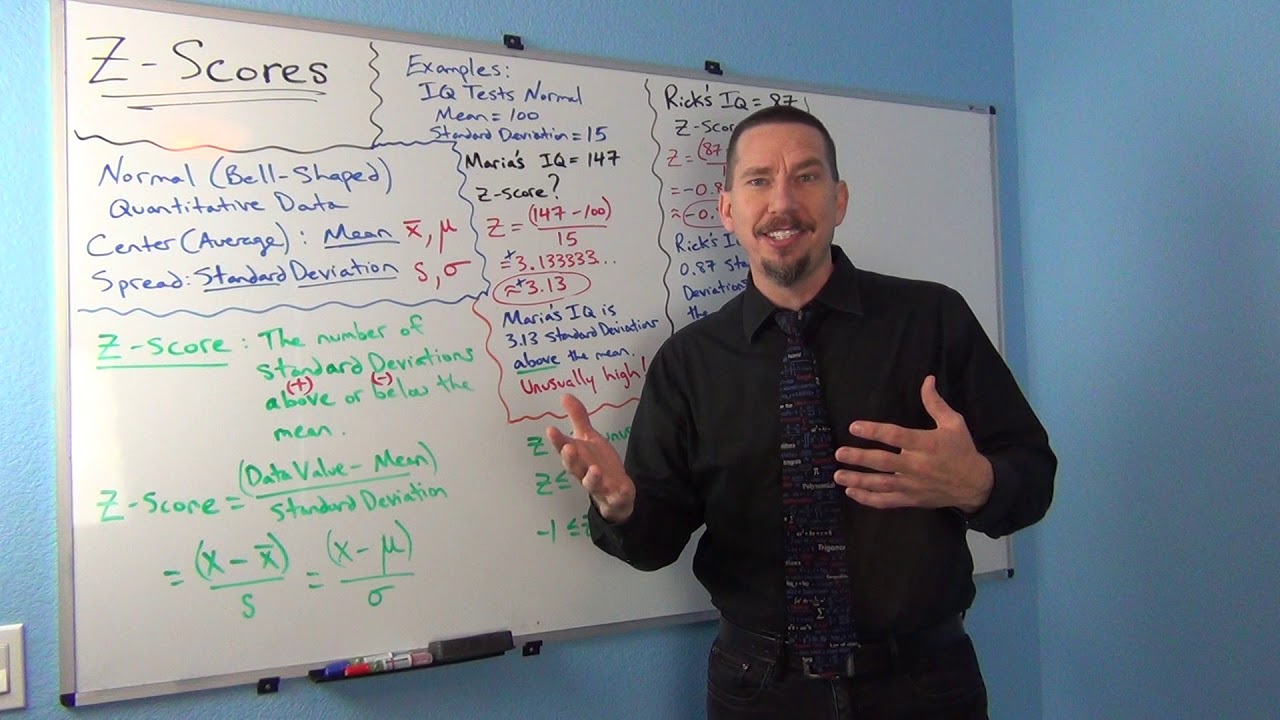

5.0 / 5 (0 votes)
