Intro to Z-scores
Summary
TLDRThis video introduces the concept of Z-scores, focusing on their importance in statistics, particularly with normal, quantitative data. It explains how Z-scores are calculated using the mean and standard deviation, and how they help compare individual data points to the group average. The presenter uses examples like IQ scores to demonstrate Z-score calculation and interpretation, emphasizing how Z-scores indicate whether a value is above or below the mean, and how they help identify typical or unusual data points. The video provides a foundational understanding for further discussions on Z-scores.
Takeaways
- 📊 Z-scores are crucial for normal quantitative data and are used in various statistical scenarios like critical values, confidence intervals, and test statistics for proportions.
- 📉 Z-scores are based on normal distribution, where the mean and standard deviation accurately represent the data. The data must be normally distributed for the Z-score to be valid.
- 📏 The formula for calculating a Z-score involves taking the data value, subtracting the mean, and dividing by the standard deviation.
- 👍 A positive Z-score indicates a value above the mean, while a negative Z-score means the value is below the mean.
- 🧠 Example: In an IQ test with a mean of 100 and a standard deviation of 15, Maria’s IQ of 147 has a Z-score of 3.13, meaning her score is 3.13 standard deviations above the mean.
- 📐 Z-scores can be used to identify outliers, where values two standard deviations above or below the mean (Z-scores greater than or equal to 2 or less than or equal to -2) are considered unusual.
- 👥 Z-scores between -1 and 1 are typical, as they represent data that falls within one standard deviation of the mean, covering around 68% of normally distributed data.
- 🧮 Z-scores are not percentages, proportions, or units like dollars or miles. They are measured in terms of standard deviations, a way to standardize and compare data across different scales.
- 🔍 Z-scores also help in determining statistical significance, where Z-scores beyond certain thresholds indicate significantly high or low data points.
- 📚 The script emphasizes the importance of understanding Z-scores as a tool for comparing data and identifying whether data points are typical, unusual, or outliers.
Q & A
What is a z-score?
-A z-score represents the number of standard deviations a data point is from the mean. It is used to compare an individual data point to the overall dataset.
When should z-scores be used?
-Z-scores should be used when working with normal or bell-shaped data, as the calculation relies on accurate mean and standard deviation values.
How do you calculate a z-score?
-To calculate a z-score, subtract the mean from the data value, then divide the result by the standard deviation. The formula is: (data value - mean) / standard deviation.
What does a positive z-score indicate?
-A positive z-score indicates that the data value is above the mean.
What does a negative z-score indicate?
-A negative z-score indicates that the data value is below the mean.
How do you interpret z-scores in terms of outliers?
-A z-score greater than or equal to 2 indicates a high outlier, while a z-score less than or equal to -2 indicates a low outlier.
What is considered a typical z-score range?
-A typical z-score falls between -1 and 1, which corresponds to the middle 68% of values in a normal distribution.
How would you calculate the z-score for Maria's IQ of 147 if the mean is 100 and the standard deviation is 15?
-To calculate Maria's z-score, subtract 100 from 147 to get 47, then divide 47 by 15. The result is a z-score of 3.13, indicating that Maria's IQ is 3.13 standard deviations above the mean.
What does a z-score of 3.13 for Maria’s IQ mean?
-Maria’s z-score of 3.13 means her IQ is 3.13 standard deviations above the mean, indicating that she has an unusually high IQ compared to the general population.
How do z-scores relate to significance in statistics?
-Z-scores are often used in significance testing. Values greater than or equal to 2 (or less than or equal to -2) are considered unusual and may indicate statistical significance.
Outlines

This section is available to paid users only. Please upgrade to access this part.
Upgrade NowMindmap

This section is available to paid users only. Please upgrade to access this part.
Upgrade NowKeywords

This section is available to paid users only. Please upgrade to access this part.
Upgrade NowHighlights

This section is available to paid users only. Please upgrade to access this part.
Upgrade NowTranscripts

This section is available to paid users only. Please upgrade to access this part.
Upgrade NowBrowse More Related Video
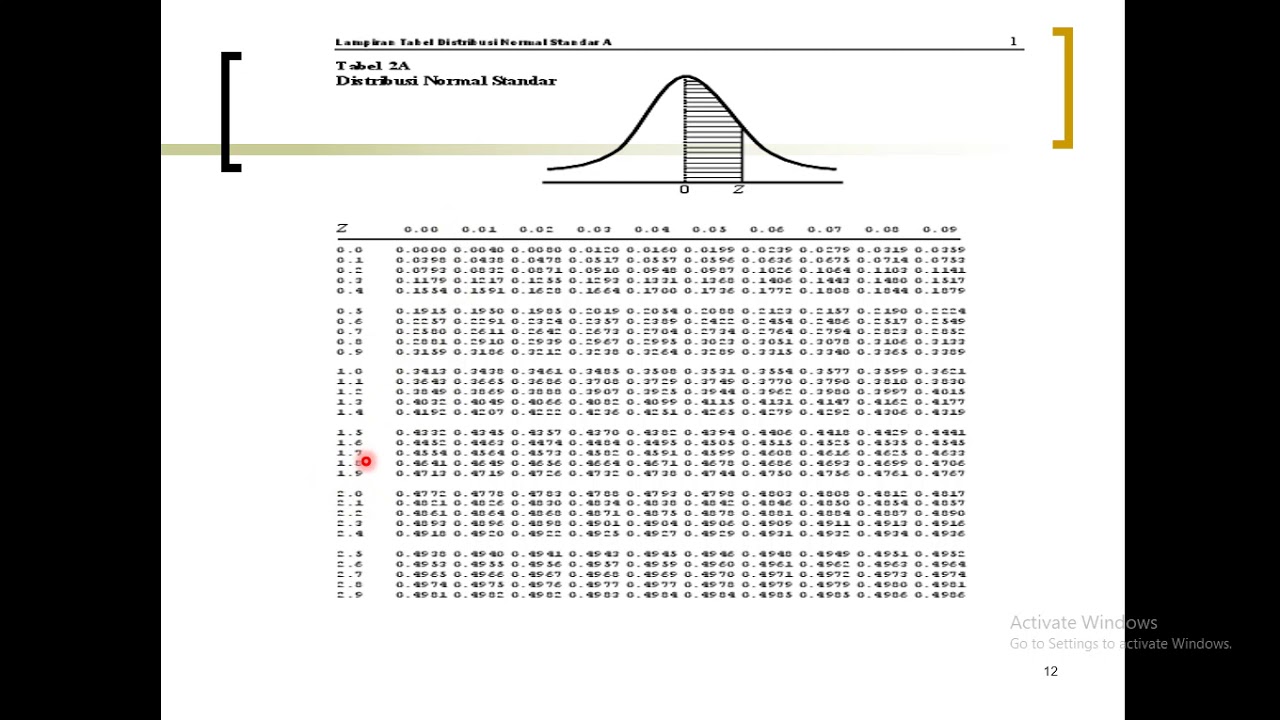
Distribusi Probabilitas Normal
Statistika Matematika Kelas 12 • Part 1: Pengertian Statistika dan Jenis-Jenis Data
CONVERTING A NORMAL RANDOM VARIABLE TO A STANDARD NORMAL VARIABLE AND VICE VERSA
Distribusi Normal | Konsep Dasar dan Sifat Kurva Normal | Matematika Peminatan Kelas 12
Z-Scores and Percentiles: Crash Course Statistics #18

[PART 1] STATISTIKA PENDIDIKAN: MENGENAL DATA
5.0 / 5 (0 votes)