Are NVDA Bulls Back? - NVDA Stock, SPY, QQQ Update
Summary
TLDRIn this Nvidia daily update, the presenter discusses the stock's recent performance, noting a nearly 2% after-hours rise driven by Oracle earnings. They analyze technical levels, highlighting key support around 169-170 and potential resistance near 174, suggesting a short-term bullish momentum while cautioning on longer-term declines. The video also covers market context, broader trends in QQQ, upcoming economic events, and unusual Nvidia options activity indicating bullish sentiment. The analysis blends chart patterns, EMA trends, and practical trading insights, offering viewers a clear perspective on what to watch for in Nvidia's near-term movement and potential opportunities for trading or investment.
Takeaways
- 📈 Nvidia is up nearly 2% after hours, influenced by Oracle's earnings report.
- 💹 Short-term bullish momentum is observed due to oversold conditions and minor recovery.
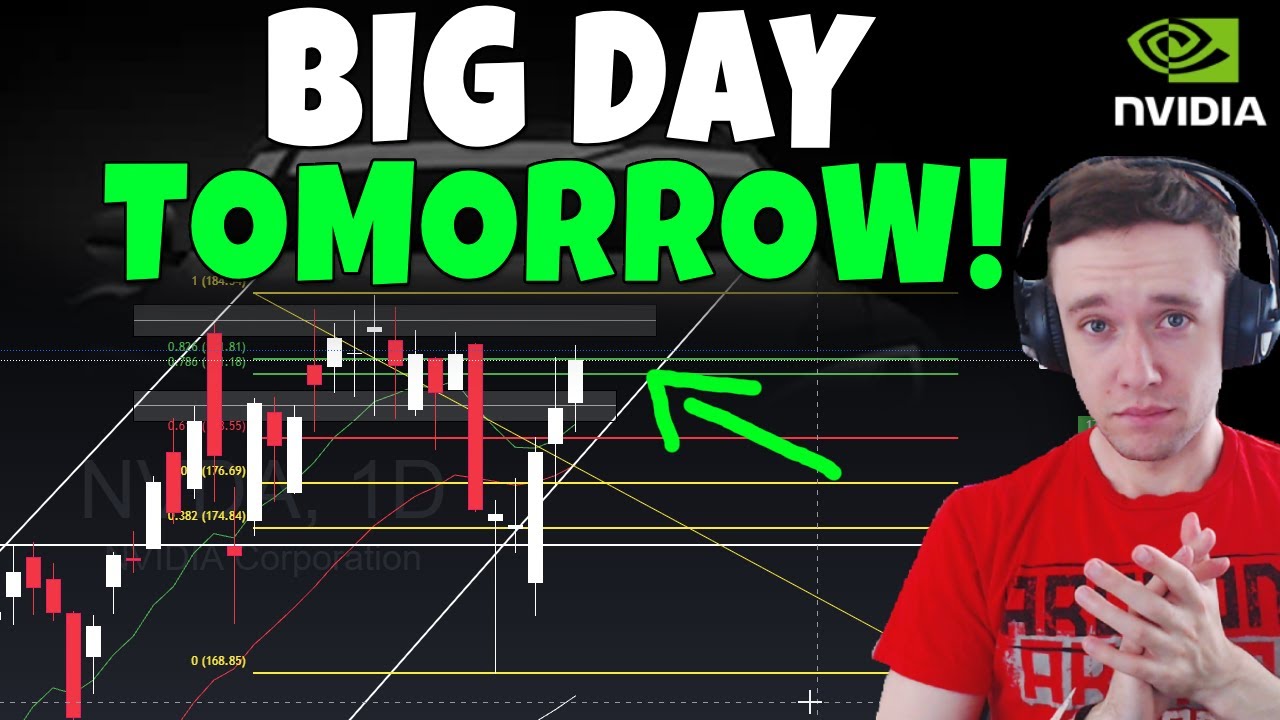
- 🔑 Key support levels are $169–170, while resistance is around $173–175.
- 🚀 Reclaiming $174 could open the path for a potential retest of $177–180.
- ⚠️ Loss of $169–170 support may signal a larger pullback, possibly toward $150.
- 📊 Technical indicators like EMAs and Bollinger Bands suggest short-term buying opportunities.
- 📉 Larger-cap stocks like Nvidia tend to decline more slowly, making abrupt drops less likely.
- 💡 Formation of bullish patterns (bull flag, wedge, or sideways action) could extend gains.
- 💵 Unusual options activity (800K call at 172.5 strike) indicates bullish sentiment among traders.
- 🌐 Broader market context: QQQ is holding mid-570s; upcoming CPI, PBI, and rate decisions may introduce volatility.
- 👀 The host recommends monitoring levels step by step and avoiding predictions on exact timing.
- 💬 Membership insights provided additional trade ideas, including personal cash-secured put strategies.
Q & A
What caused Nvidia's stock to rise in the after-hours trading mentioned in the video?
-Nvidia's stock rose nearly 2% after hours due to a positive reaction in the semiconductor sector, largely influenced by Oracle's earnings report, which showed an 18% increase.
What short-term target was mentioned for Nvidia in the video?
-The short-term target mentioned was around 174, with after-hours trading already approaching 173–174 following the earnings-driven pop.
Which technical indicators suggest short-term bullish momentum for Nvidia?
-Indicators suggesting short-term bullish momentum include Nvidia being oversold, support holding near 169–170, Bollinger Bands at the bottom, and EMAs remaining bullish without crossing below the 50 EMA.
What key support level would indicate potential concern if broken?
-If Nvidia falls below the 169–170 support level, it would be a concerning sign and could indicate a potential downward move towards 150.
What conditions need to occur for Nvidia to potentially reach new all-time highs?
-Nvidia would need to reclaim the 174 area and hold it as support, or form a bullish pattern between 169–174, to increase the likelihood of moving higher toward 177–180 or potentially all-time highs.
What types of bullish patterns are mentioned in the video?
-Bullish patterns mentioned include flags, wedges, or sideways consolidation. The video notes that the specific type of pattern is less important than the overall bullish signal they indicate.
How does Nvidia’s large-cap status influence its price movements?
-As a large-cap stock, Nvidia's price movements are slower and more consistent, making it unlikely to collapse quickly like a small-cap stock, which helps support short-term bullish rebounds.
What broader market factors could influence Nvidia’s performance in the near term?
-Broader market factors include QQQ holding above EMAs, upcoming economic data such as PPI and CPI reports, and potential rate cuts next week, all of which could increase volatility and impact Nvidia.
What key levels are important for the broader market as discussed in the video?
-For the broader market, key levels include 575 for bulls to maintain control and 560 for bears to regain influence. Below 560, bearish momentum becomes more convincing.
What unusual options activity was noted and what does it indicate?
-The video mentions an unusual call flow with 800K contracts at the 172.5 strike for Nvidia, indicating market participants were betting on a positive reaction to Oracle's earnings, reinforcing the bullish outlook.
Why does the speaker emphasize taking things 'one step at a time' with Nvidia?
-The speaker emphasizes caution because short-term bullish momentum does not guarantee long-term gains. Key levels and patterns need to be monitored to confirm sustained bullishness or identify potential reversals.
What role do EMAs play in the technical analysis of Nvidia?
-EMAs (Exponential Moving Averages) help gauge the overall trend. Nvidia's EMAs are currently bullish, and a cross below the 50 EMA would signal potential red flags for bearish momentum.
Outlines

このセクションは有料ユーザー限定です。 アクセスするには、アップグレードをお願いします。
今すぐアップグレードMindmap

このセクションは有料ユーザー限定です。 アクセスするには、アップグレードをお願いします。
今すぐアップグレードKeywords

このセクションは有料ユーザー限定です。 アクセスするには、アップグレードをお願いします。
今すぐアップグレードHighlights

このセクションは有料ユーザー限定です。 アクセスするには、アップグレードをお願いします。
今すぐアップグレードTranscripts

このセクションは有料ユーザー限定です。 アクセスするには、アップグレードをお願いします。
今すぐアップグレード


5.0 / 5 (0 votes)
