The Business of English - Episode Eight: Graphs and Trends
Summary
TLDRIn this presentation, the speaker explores how to present business sales data using bar graphs, line graphs, and pie charts. By analyzing sales trends over 10 months, the speaker demonstrates how to describe increases, decreases, and seasonal fluctuations in sales. Key terminology for explaining trends and causes is introduced, such as 'increase,' 'decline,' and 'due to.' The speaker also addresses how to handle questions, providing clear phrasing for attributing changes in sales to factors like interest rate rises and seasonal effects. The video serves as a practical guide for interpreting and presenting data in business contexts.
Takeaways
- 😀 The script introduces different types of graphs used to present data: bar graphs, line graphs, and pie charts.
- 😀 The bar graph shows net sales over the first 10 months of the year, highlighting trends such as steady sales, a peak in May, a drop in July, and a rise in August.
- 😀 A sharp drop in sales during July was mainly due to a seasonal decrease in air conditioner sales.
- 😀 The line graph compares air conditioner and heater sales, showing a steady decline in air conditioner sales and a significant increase in heater sales during different months.
- 😀 Seasonal effects are highlighted as a reason for fluctuations in air conditioner and heater sales, with heaters performing better in colder months.
- 😀 The pie chart illustrates that air conditioners and heaters together represent more than half of the total sales, which vary seasonally, while other appliances show more consistent sales.
- 😀 Seasonal sales fluctuations can be mitigated by exporting products to regions with different climates, such as Europe and America.
- 😀 The script explains how to describe changes in data trends, using phrases like 'increase,' 'decrease,' 'rise,' and 'fall,' along with descriptive adjectives and adverbs.
- 😀 The use of verbs and adjectives to describe trends is emphasized, with examples such as 'sales rose steadily' and 'there was a significant drop in sales.'
- 😀 Key phrases to describe causes of sales changes include 'due to,' 'because of,' and 'a consequence of,' which help explain fluctuations in data.
- 😀 The script also provides examples of how to express the proportion of sales, such as 'air conditioners and heaters account for more than half of sales,' to convey data effectively.
Q & A
What is the purpose of the bar graph mentioned in the transcript?
-The bar graph measures net sales over the first 10 months of the year, showing the fluctuations in sales, including the rise in April, the drop in July, and subsequent increases.
Why did sales drop significantly in July according to the transcript?
-The significant drop in sales during July was mainly due to a decrease in air conditioner sales, which is a seasonal effect.
What was the reason for the increase in air conditioner sales in April and May?
-The increase in air conditioner sales in April and May was due to the seasonal demand for air conditioners as the weather warmed up.
How does the line graph differentiate between air conditioner and heater sales?
-The line graph uses different colored lines to represent air conditioner sales (blue line) and heater sales (red line), illustrating the seasonal variations for each product.
What is the main trend shown in the pie chart?
-The pie chart shows that air conditioners and heaters together account for more than half of total sales, with these products experiencing significant seasonal variation.
What seasonal effect impacts air conditioner sales, according to the transcript?
-Air conditioner sales are influenced by weather patterns, with higher sales in warmer months and a decline in colder months.
What solution is suggested for dealing with seasonal fluctuations in air conditioner sales?
-The solution suggested is to export air conditioners to Europe and America, where the seasonal demand may differ from the local market.
How does Tan handle the fluctuation in heater sales in his presentation?
-Tan explains that heater sales experienced a sharp increase from March to June but dropped significantly from June to July and declined through to September, with a pronounced drop in October.
What vocabulary is used to describe the changes in sales figures?
-Tan uses words such as 'increase,' 'decrease,' 'rise,' 'fall,' 'improvement,' 'decline,' and their respective adjectives and adverbs (e.g., 'dramatic,' 'sharp,' 'slightly') to describe changes in sales figures.
What does the phrase 'bottomed out' mean in the context of the air conditioner sales graph?
-In this context, 'bottomed out' means that air conditioner sales reached their lowest point in July before stabilizing or starting to increase again.
Outlines

このセクションは有料ユーザー限定です。 アクセスするには、アップグレードをお願いします。
今すぐアップグレードMindmap

このセクションは有料ユーザー限定です。 アクセスするには、アップグレードをお願いします。
今すぐアップグレードKeywords

このセクションは有料ユーザー限定です。 アクセスするには、アップグレードをお願いします。
今すぐアップグレードHighlights

このセクションは有料ユーザー限定です。 アクセスするには、アップグレードをお願いします。
今すぐアップグレードTranscripts

このセクションは有料ユーザー限定です。 アクセスするには、アップグレードをお願いします。
今すぐアップグレード関連動画をさらに表示
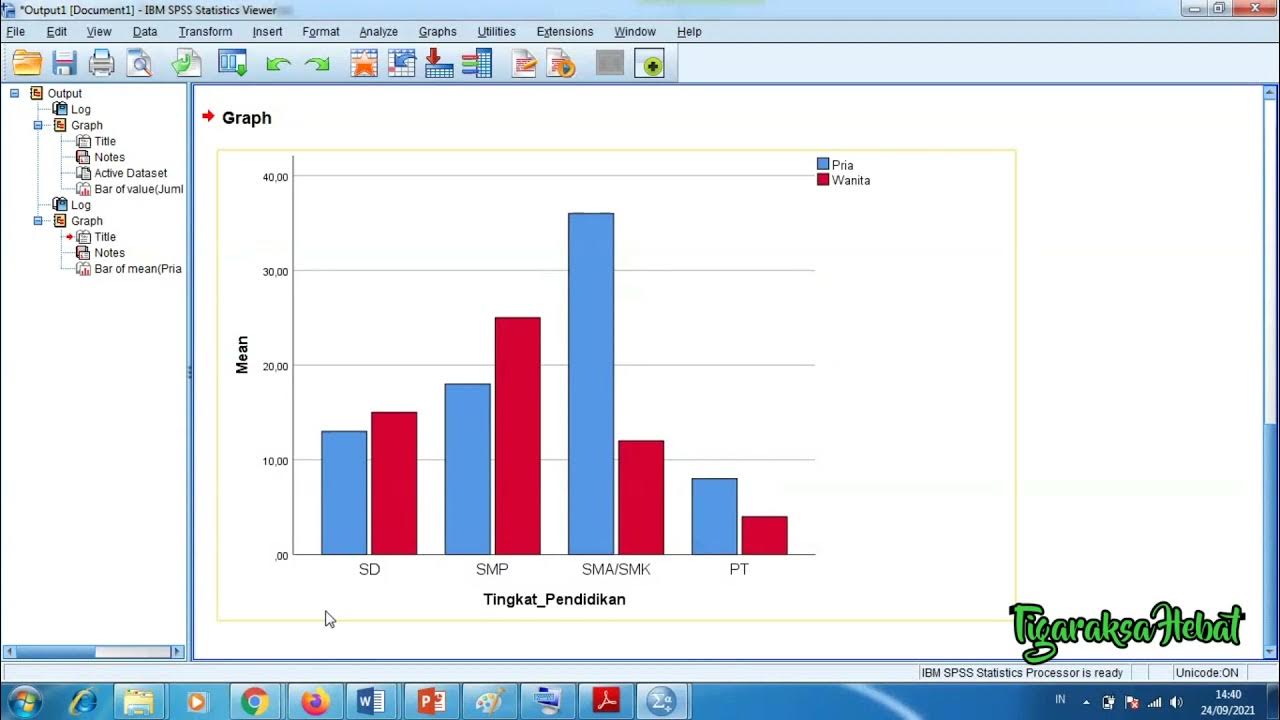
Penyajian Data Statistik Menggunakan SPSS
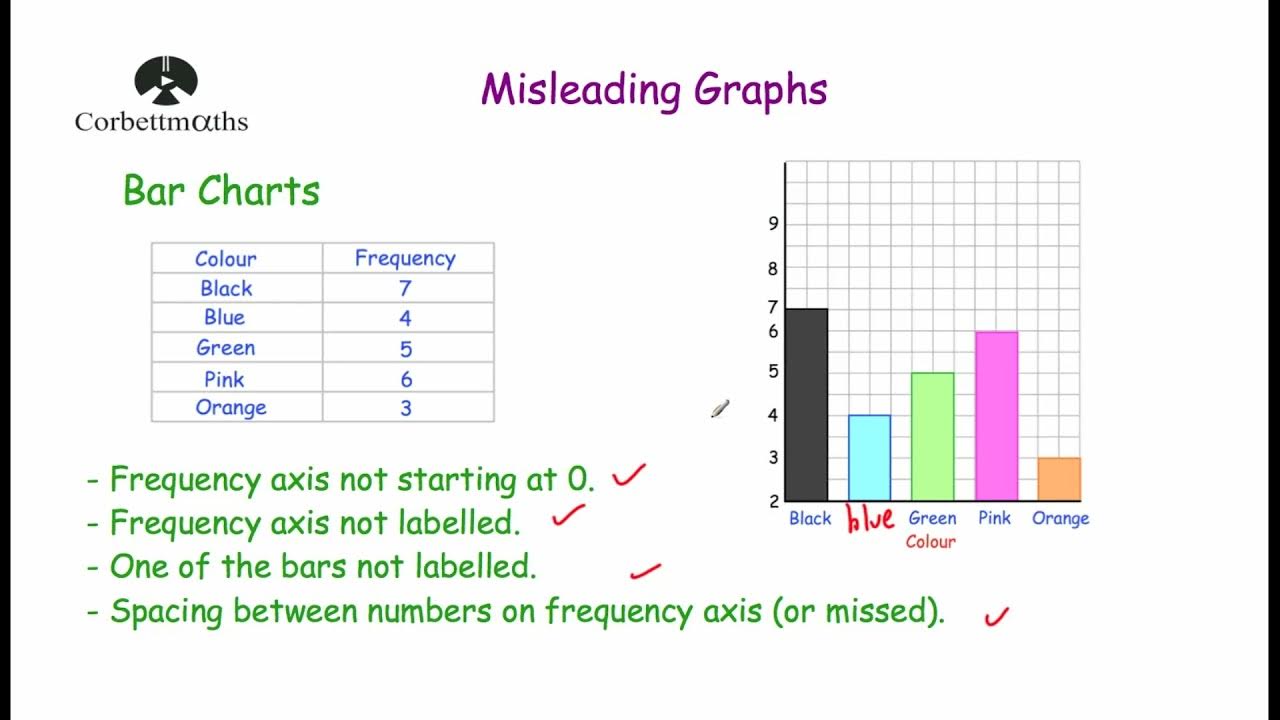
Misleading Graphs - Corbettmaths
Membaca Grafik Dalam Bahasa Inggris || Eni Kesuma
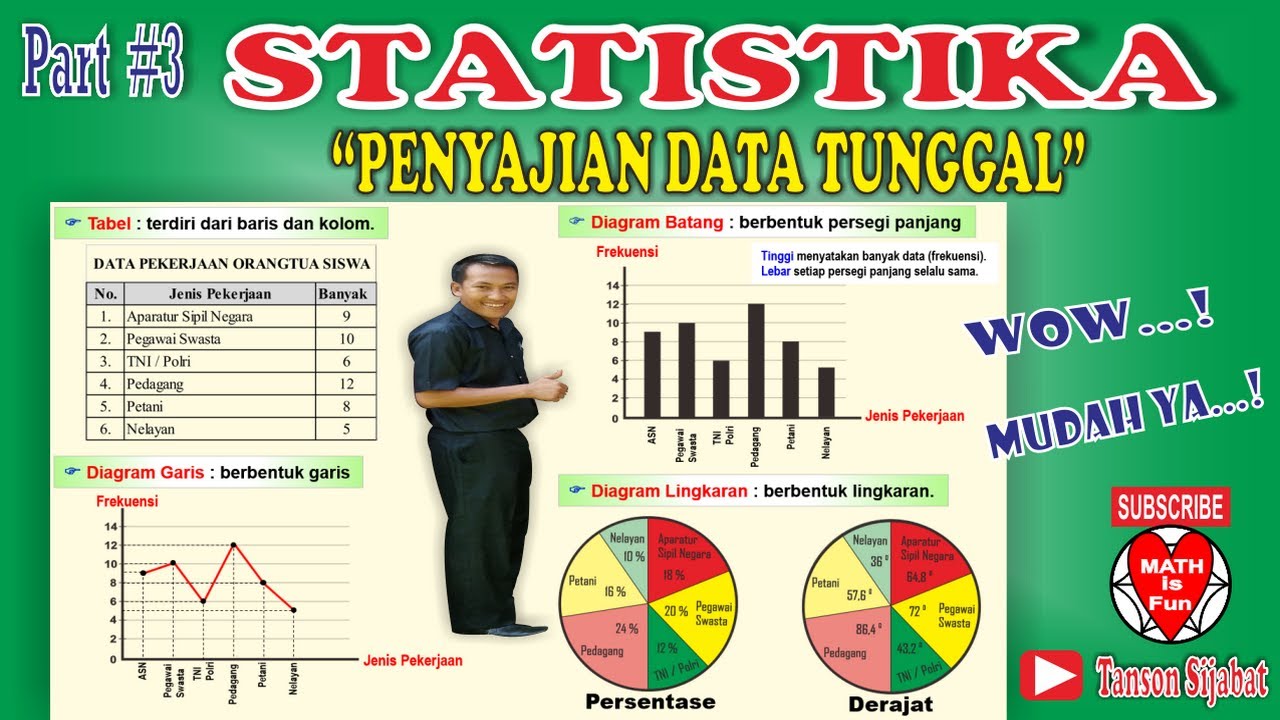
STATISTIKA | PENYAJIAN DATA TUNGGAL [Tabel, Diagram Garis, Diagram Batang, Lingkaran]

Penyajian Data (Part-1) ~ Tabel dan Diagram (Materi PJJ Kelas VII / 7 SMP)

1 PENYAJIAN DATA - STATISTIKA - KELAS 7 SMP
5.0 / 5 (0 votes)
