Path Analysis dengan SPSS - Cara Analisis Jalur di SPSS
Summary
TLDRIn this video, the instructor explains path analysis using the SPSS program, specifically focusing on a case study about the effect of compensation and work environment on job satisfaction and employee performance. The video outlines how to test various hypotheses using regression analysis, including the direct and indirect effects of compensation and work environment on job satisfaction and employee performance. The instructor demonstrates the step-by-step process in SPSS version 23, providing interpretations of the regression output and concludes with a summary of the results, clarifying which hypotheses are accepted or rejected.
Takeaways
- 😀 Path analysis is an extension of regression analysis used to understand the indirect effects of independent variables through an intervening variable on a dependent variable.
- 😀 The three main types of variables in path analysis are independent variables, dependent variables, and intervening variables.
- 😀 An example research title used in path analysis is 'The effect of compensation and work environment on job satisfaction, and its impact on employee performance at PT AS 28 group.'
- 😀 The study involves two independent variables: compensation and work environment, one dependent variable: job satisfaction, and one intervening variable: employee performance.
- 😀 The research hypotheses tested are: (1) Compensation affects job satisfaction, (2) Work environment affects job satisfaction, (3) Compensation affects employee performance through job satisfaction, and (4) Work environment affects employee performance through job satisfaction.
- 😀 In SPSS, two separate data analyses are conducted: one for hypotheses 1 and 2, and another for hypotheses 3 and 4.
- 😀 The regression analysis output helps interpret the relationships between variables, focusing on significance values and the model summary table.
- 😀 In the first analysis, both compensation (p = 0.003) and work environment (p = 0.000) were found to have a significant effect on job satisfaction.
- 😀 The R-squared value of 0.702 in the first analysis means that compensation and work environment contribute to 70.2% of job satisfaction.
- 😀 In the second analysis, compensation (p = 0.000), work environment (p = 0.022), and job satisfaction (p = 0.000) significantly affect employee performance, with R-squared at 0.905.
- 😀 The direct and indirect effects in path analysis are calculated using standardized coefficient beta values. Compensation has a direct effect of 0.328, and an indirect effect through job satisfaction of 0.192, while work environment has a direct effect of 0.192 and an indirect effect of 0.259 on employee performance.
Q & A
What is path analysis, and how is it related to regression analysis?
-Path analysis is an extension of regression analysis that aims to determine the indirect effect of an independent variable through an intervening variable on a dependent variable.
What are the three types of variables used in path analysis?
-The three types of variables in path analysis are the independent variable, the dependent variable, and the intervening (moderator) variable.
What was the research case example used to demonstrate path analysis?
-The research case example was titled 'The effect of compensation and work environment on job satisfaction, and its impact on employee performance at PT AS 28 group.'
What are the four hypotheses proposed in the research?
-The four hypotheses proposed are: 1) Compensation has an effect on job satisfaction, 2) Work environment has an effect on job satisfaction, 3) Compensation through job satisfaction affects employee performance, 4) Work environment through job satisfaction affects employee performance.
How do you perform the first data analysis to test the first two hypotheses in SPSS?
-In SPSS, you select the 'Analyze' menu, then choose 'Regression' and 'Linear.' You place the job satisfaction variable in the dependent column and the compensation and work environment variables in the independent column, then click 'OK' to get the regression output.
What does the significance value in the regression output tell us about the hypotheses?
-A significance value less than 0.05 indicates that the independent variable has a significant effect on the dependent variable. In this case, both compensation (0.003) and work environment (0.000) have a significant effect on job satisfaction.
What does the R-square value of 0.702 represent in the first data analysis?
-The R-square value of 0.702 means that 70.2% of the variance in job satisfaction is explained by the compensation and work environment variables.
How do you calculate the error term (e1) in the first analysis?
-The error term (e1) is calculated using the formula: the square root of (1 minus the R-square value). For the first analysis, e1 is the square root of (1 - 0.702), which equals 0.545.
What is the path diagram in path analysis, and how is it used?
-A path diagram visually represents the direct effects of variables on each other. In the first model, the compensation variable has a direct influence of 0.381 on job satisfaction, and the work environment variable has a direct influence of 0.513 on job satisfaction.
In the second data analysis, which variables are analyzed to test hypotheses 3 and 4?
-In the second data analysis, the dependent variable is employee performance, and the independent variables are compensation, work environment, and job satisfaction.
How is the indirect effect calculated in path analysis?
-The indirect effect is calculated by multiplying the beta coefficient of the independent variable on the intervening variable (job satisfaction) with the beta coefficient of the intervening variable on the dependent variable (employee performance). For example, compensation's indirect effect on employee performance is calculated as 0.381 (compensation's effect on job satisfaction) times 0.506 (job satisfaction's effect on employee performance).
What were the conclusions about the third and fourth hypotheses based on the analysis?
-The third hypothesis, which suggests that compensation through job satisfaction affects employee performance, was rejected because the indirect effect (0.192) was smaller than the direct effect (0.328). The fourth hypothesis, which suggests that the work environment through job satisfaction affects employee performance, was accepted because the indirect effect (0.259) was greater than the direct effect (0.192).
How does path analysis help in understanding the relationship between variables in research?
-Path analysis helps identify and quantify the direct and indirect effects between variables, allowing researchers to better understand how one variable affects another, either directly or through an intervening variable.
Outlines

このセクションは有料ユーザー限定です。 アクセスするには、アップグレードをお願いします。
今すぐアップグレードMindmap

このセクションは有料ユーザー限定です。 アクセスするには、アップグレードをお願いします。
今すぐアップグレードKeywords

このセクションは有料ユーザー限定です。 アクセスするには、アップグレードをお願いします。
今すぐアップグレードHighlights

このセクションは有料ユーザー限定です。 アクセスするには、アップグレードをお願いします。
今すぐアップグレードTranscripts

このセクションは有料ユーザー限定です。 アクセスするには、アップグレードをお願いします。
今すぐアップグレード関連動画をさらに表示

Pertemuan 9- Kepuasan Kerja

Belajar SEM - Studi Kasus Latihan 1
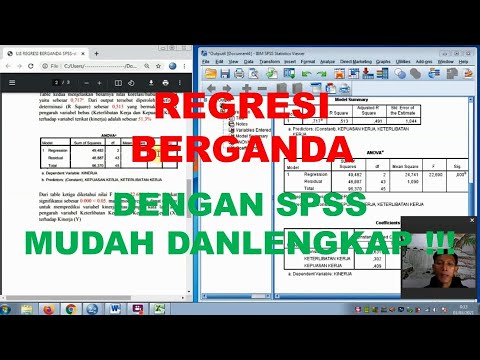
TUTORIAL MUDAH UJI REGRESI BERGANDA DENGAN SPSS

PERILAKU KEORGANISASIAN - KELOMPOK 8 - RESTORAN DIKICHI
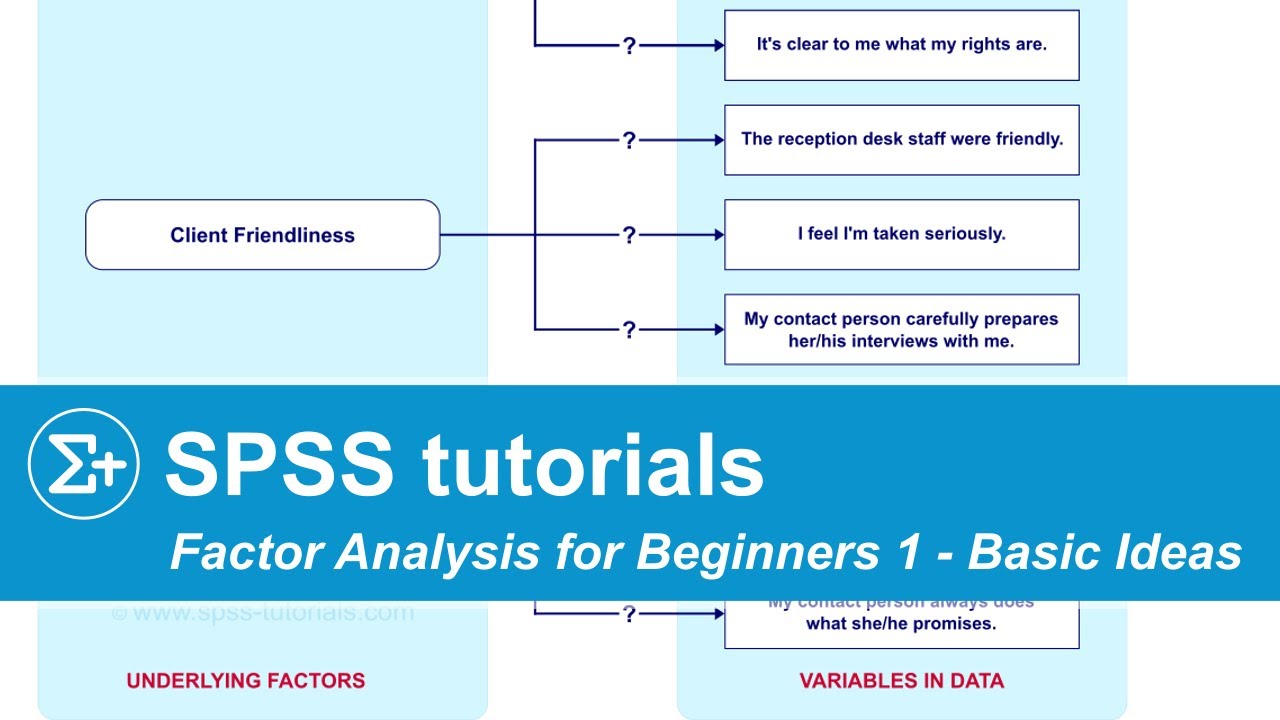
SPSS Factor Analysis for Beginners 1 - Basic Ideas

10. SI SDM: Pengembangan Karir, Motivasi, Kepuasan, Disiplin Kerja, dan Pemberhentian Pegawai
5.0 / 5 (0 votes)
