SPSS Factor Analysis for Beginners 1 - Basic Ideas

SPSS tutorials
22 Sept 202419:46

Summary

TLDRIn this SPSS tutorial, Ruben introduces the concept of factor analysis through a case study on client satisfaction with the Dutch unemployment agency. The agency uses 16 survey questions to assess their performance, with responses scored on a 7-point scale. Ruben explains the limitations of calculating mean scores and introduces factor analysis as a method to identify underlying factors from the survey data. He discusses exploratory factor analysis (EFA) in SPSS, which aims to determine the number of factors, which items measure them, and what real-world characteristics they represent. The tutorial also covers the use of eigenvalues to assess factor quality and the interpretation of factor loadings.

Takeaways

  • ๐Ÿ“Š **Factor Analysis Basics**: The video introduces the basic concept of factor analysis, which is a statistical method used to describe variability among observed variables in terms of fewer unobserved variables called factors.
  • ๐Ÿ‡ณ๐Ÿ‡ฑ **Case Study Context**: The case study revolves around a Dutch unemployment agency aiming to assess client satisfaction through a survey, highlighting the practical application of factor analysis.
  • ๐Ÿ“ **Survey Design**: The agency formulated 16 survey questions to measure client satisfaction, each scored on a 7-point Likert scale, demonstrating a common research methodology.
  • ๐Ÿค” **Philosophical Questioning**: The video raises questions about whether client satisfaction is made up of separate aspects and if some statements might measure the same underlying sentiments.
  • ๐Ÿ“Š **Factor Analysis Diagram**: A diagram is used to illustrate how nine out of 16 statements might measure only three underlying factors, simplifying the data into more manageable components.
  • ๐Ÿ” **Exploratory vs Confirmatory Factor Analysis**: The tutorial differentiates between exploratory factor analysis (EFA) and confirmatory factor analysis (CFA), with EFA being more about discovering the factor structure within the data.
  • ๐Ÿ”ข **Correlation Analysis**: The video explains how correlations among variables can indicate the presence of underlying factors, with high correlations suggesting shared factors.
  • ๐ŸŸข **Conditional Formatting**: A practical tip is given on using conditional formatting in Excel to visualize correlations, making it easier to identify patterns.
  • ๐Ÿงฎ **Eigenvalues**: The concept of eigenvalues is introduced as a method to determine the number of factors to retain, with factors having eigenvalues over one considered significant.
  • ๐Ÿ“ˆ **Factor Loadings**: Factor loadings are mentioned as a way to interpret how strongly each item is related to a factor, which is crucial for understanding what each factor represents.
  • ๐Ÿ“Š **Dimension Reduction**: Factor analysis is positioned as a method of dimension reduction, simplifying data sets from multiple variables to a few underlying factors for easier analysis and reporting.

Q & A

  • What is the main purpose of the unemployment agency in the Netherlands mentioned in the script?

    -The main purpose of the unemployment agency in the Netherlands is twofold: first, to provide unemployed people with monthly income known as 'doll', and second, to assist unemployed individuals in finding employment.

  • What is the significance of the 16 survey questions formulated by the unemployment agency?

    -The 16 survey questions are significant as they were designed to measure client satisfaction, which helps the unemployment agency assess their performance in assisting and providing income to unemployed people.

  • What is the likert scale mentioned in the script, and how is it used?

    -The likert scale is a 7-point scale used to measure responses to statements, with each point representing a level of agreement or disagreement. In this case, it is used to score the 16 statements regarding client satisfaction.

  • Why might computing the mean scores for each statement not be the best method to evaluate performance according to the script?

    -Computing the mean scores might not be the best method because it doesn't account for the different aspects of client satisfaction that each statement might represent, nor does it consider the possibility that some statements might measure the same underlying sentiment.

  • What is the basic idea behind factor analysis as introduced in the script?

    -The basic idea behind factor analysis is to identify the underlying factors or dimensions that explain the correlations among a set of observed variables. In the context of the script, it is used to simplify the 16 satisfaction statements into a smaller number of factors.

  • What is the difference between exploratory factor analysis (EFA) and confirmatory factor analysis (CFA)?

    -Exploratory Factor Analysis (EFA) is used to identify the underlying structure of a set of variables, whereas Confirmatory Factor Analysis (CFA) is used to test whether observed data fit a proposed factor model.

  • What are the three basic questions EFA tries to answer according to the script?

    -The three basic questions EFA tries to answer are: 1) How many underlying factors are measured by the variables? 2) Which items measure which factors? 3) What real-world characteristics do the factors represent?

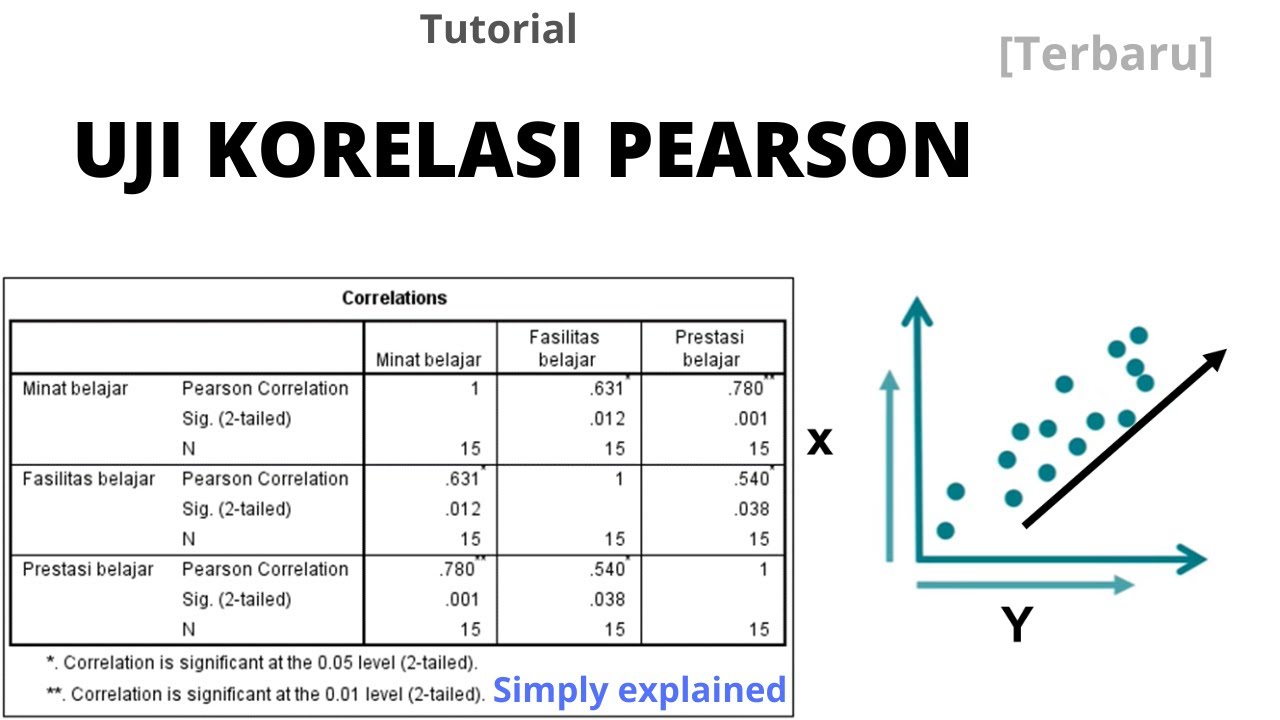
  • What is a Pieron correlation and how is it used in factor analysis?

    -A Pieron correlation is a numerical value between -1 and +1 that indicates the extent to which two quantitative variables are linearly related. In factor analysis, it is used to identify patterns of correlations among variables, which can suggest the underlying factors.

  • What is the significance of the eigenvalues in factor analysis?

    -Eigenvalues in factor analysis are used to determine the number of factors to retain. It is common practice to retain factors with eigenvalues greater than one, as they are considered to represent significant variance in the data.

  • How can factor loadings help in interpreting factors in factor analysis?

    -Factor loadings indicate the correlation between each item and the factors. They help in interpreting factors by showing which items have a stronger relationship with each factor, thus providing insight into what each factor represents.

  • What is the practical application of factor analysis mentioned in the script?

    -The practical application of factor analysis mentioned in the script is dimension reduction, where the original variables (statements) are reduced to a smaller number of factors, which can then be used for reporting or further analysis.

Outlines

00:00

๐Ÿ“Š Introduction to Factor Analysis

Ruben from SPSS Tutorials introduces the concept of factor analysis, starting with a case study on unemployment agency performance in the Netherlands. The agency uses 16 survey questions to measure client satisfaction, scored on a 7-point scale. Ruben points out the limitations of simply computing mean scores for each statement and introduces the idea that some statements might measure the same underlying client sentiments, which is the fundamental concept behind factor analysis. He explains that factor analysis aims to reduce the number of observed variables into a smaller set of underlying factors, using a diagram to illustrate how nine statements might measure just three underlying factors.

05:04

๐Ÿ” Exploratory Factor Analysis (EFA) in SPSS

The tutorial delves into Exploratory Factor Analysis (EFA), which is used to identify the underlying structure of a set of observed variables. Ruben explains that EFA is one of two main types of factor analysis, the other being Confirmatory Factor Analysis (CFA). He clarifies that EFA is available in SPSS and is used to determine the likely factor model for a given dataset. The video outlines the three basic questions EFA aims to answer: the number of underlying factors, which items measure which factors, and what real-world characteristics the factors represent. Ruben also discusses how EFA starts by computing the pairwise correlations among all variables and uses scatter plots to visualize these correlations.

10:04

๐Ÿ“ˆ Analyzing Correlations and Identifying Factors

Ruben demonstrates how to analyze correlations to identify underlying factors. He uses a hypothetical model where the first three items measure the same underlying factor, 'information clarity,' and shows that these items should have strong positive correlations. The video then compares this model to the actual correlations found in the data, using conditional formatting in Excel to visualize the correlation matrix. Ruben explains how the pattern of correlations can suggest the number of underlying factors and which items measure which factors. He also touches on the challenge of interpreting what the factors represent in the real world, using the example of items related to reliability and information clarity.

15:07

๐Ÿ“‹ Practical Considerations for Factor Analysis

The final paragraph addresses the practical aspects of conducting factor analysis. Ruben acknowledges the complexity of real-world datasets, which often require more sophisticated techniques due to large and intricate correlation matrices. He reiterates the use of conditional formatting to identify patterns in correlations and mentions the use of eigenvalues to determine the number of real factors. Ruben also discusses the interpretation of factor loadings, which indicate how strongly items measure certain factors, and the practice of adding actual factor scores to the dataset for reporting. The video concludes with a reminder to perform thorough data screening before running the analysis and encourages viewers to like and subscribe for more tutorials.

Mindmap

Keywords

๐Ÿ’กFactor Analysis

Factor analysis is a statistical method used to describe variability among observed, correlated variables in terms of a potentially lower number of unobserved variables called factors. In the video, factor analysis is introduced as a way to understand how a set of variables might be underpinned by a smaller set of underlying factors. The example of the Dutch unemployment agency's client satisfaction survey is used to illustrate how factor analysis can help identify the underlying factors that contribute to client satisfaction.

๐Ÿ’กLikert Scale

The Likert scale is a psychometric scale commonly used in research that asks respondents to report their level of agreement or disagreement with a statement on a scale. In the video, the unemployment agency's survey uses a 7-point Likert scale to measure client satisfaction, allowing for a nuanced understanding of responses that goes beyond simple yes/no answers.

๐Ÿ’กExploratory Factor Analysis (EFA)

Exploratory Factor Analysis (EFA) is a method of factor analysis that aims to identify the underlying structure of a relatively large set of variables. In the video, EFA is discussed as a way to explore the dimensionality of the client satisfaction survey data, with the goal of reducing the number of variables while retaining the maximum amount of information.

๐Ÿ’กConfirmatory Factor Analysis (CFA)

Confirmatory Factor Analysis (CFA) is a statistical technique used to test the hypothesis that observed variables are related to one or more latent factors. Unlike EFA, which is exploratory, CFA is confirmatory and is used to test the validity of a factor structure. The video mentions CFA as a different type of factor analysis that is not available in SPSS, the statistical package used in the tutorial.

๐Ÿ’กEigenvalues

In the context of factor analysis, eigenvalues are numerical values that represent the amount of variance explained by each factor. The video script mentions that eigenvalues greater than one are considered to indicate significant factors, which is a common rule of thumb for determining the number of factors to retain in EFA.

๐Ÿ’กFactor Loadings

Factor loadings are the correlations between the observed variables and the factors. They indicate the strength of the relationship between each variable and the underlying factors. In the video, factor loadings are discussed as a way to interpret which items measure which factors and to what extent.

๐Ÿ’กDimension Reduction

Dimension reduction is the process of reducing the number of random variables under consideration, by obtaining a set of principal variables. In the video, factor analysis is described as a method of dimension reduction, where the original 16 satisfaction statements are reduced to a smaller number of underlying factors.

๐Ÿ’กCorrelation Matrix

A correlation matrix is a table that shows the correlation coefficients between pairs of variables. In the video, the correlation matrix is used to identify patterns of correlations among the survey items, which can suggest the presence of underlying factors.

๐Ÿ’กOrdinal Variables

Ordinal variables are data that have a natural order but the differences between the values are not necessarily equal. In the video, it is noted that the survey responses are ordinal variables, and while computing means on ordinal data is not strictly correct, it is a common practice in real-life research.

๐Ÿ’กClient Satisfaction

Client satisfaction refers to the degree of contentment a client has with the services or products they have received. In the video, the main theme revolves around measuring client satisfaction through a survey and using factor analysis to understand the different aspects that contribute to it.

๐Ÿ’กConditional Formatting

Conditional formatting is a feature in spreadsheets like Excel that allows cells to be formatted based on their values. In the video, conditional formatting is used to visualize the correlation matrix by coloring cells based on the strength of the correlation, which helps in identifying patterns.

Highlights

Introduction to the basic idea behind factor analysis.

Case study on Dutch unemployment agency's client satisfaction survey.

Explanation of the unemployment agency's dual role in providing income and employment assistance.

Description of the 16 survey questions used to measure client satisfaction.

Discussion on the use of mean scores as a performance evaluation method.

Critique of using mean scores for ordinal variables in research.

Introduction to the concept of factor analysis for dimension reduction.

Illustration of how nine statements are believed to measure three underlying factors.

Differentiation between exploratory factor analysis (EFA) and confirmatory factor analysis (CFA).

Explanation of how EFA works to identify underlying factors from observed variables.

Discussion on the three basic questions EFA tries to answer.

Use of Pearson correlation to identify patterns in data for factor analysis.

Application of conditional formatting in Excel to visualize correlation patterns.

Interpretation of the correlation matrix to determine the number of underlying factors.

Introduction to eigenvalues as a method for determining the number of real factors.

Importance of factor loadings in interpreting the strength of relations between items and factors.

Practical application of factor analysis in reducing data dimensions for reporting.

Advice on conducting thorough data screening before running the actual factor analysis.

Transcripts

play00:01

[Muziek]

play00:04

Good morning everyone This Is SPSS

play00:08

Tutorials My name is Ruben and in

play00:10

Today's video I'll cover The Basic Idea

play00:14

Behind Factor analysis and introduce Our

play00:17

First case

play00:19

Study for Our case Study we're going to

play00:22

work on Doll

play00:25

surs There No Need

play00:28

download going to start off with some

play00:31

very Basic Theory Now One Thing i' like

play00:34

to show is that the Bulk of the data are

play00:37

a bunch of statements so Let Me Give You

play00:41

Just A Little Bit of background on

play00:43

this so in the Netherlands we have an

play00:47

unemployment Agency It's actually part

play00:49

of the government and they have two Main

play00:52

tasks so first off They need to provide

play00:56

unemployed people with some monthly

play00:58

income is know as the doll and second

play01:02

They need to help unemployed people in

play01:05

Finding employment

play01:07

Again Now Our unemployment Agency Wants

play01:10

To answer an important Question Which is

play01:14

how well Are we performing and in order

play01:17

to answer this They First formul 16

play01:21

Survey questions on client Satisfaction

play01:24

and Next up They approach A Simple

play01:27

random sample of at

play01:33

stats and all ofs and anwers data

play01:39

file so Here we see the 16 statements

play01:43

and each of them is scored on a 7 Point

play01:46

lik scale with a no answer

play01:49

Option Now Here we see some of the

play01:51

Actual answers and one Option for

play01:55

evaluating the Performance is to simply

play01:58

compute the mean score over the 388

play02:01

scores on v1 compute the mean score over

play02:05

388 scores on V2 and So on Now as A

play02:10

Minor Note some May Argue that These are

play02:12

Strictly ordinal variables so computing

play02:15

means SC is not really allowed but then

play02:18

Again This is super Common in real life

play02:21

Research and also it's the only

play02:24

realistic Way To Go so in short for each

play02:28

of these 16 statements

play02:32

If Mean is Close

play02:35

To and Mean is close to One That's

play02:39

probably not such a good Mean score So

play02:42

This Is One Option but it really Isn't A

play02:46

Very Good Option so Let Me Give You A

play02:48

few Reasons Why It

play02:50

Isn't So first off There's a

play02:54

Practical is separate me

play02:58

scor client

play03:00

Satisfaction so some of these statements

play03:03

are going to be judged favora and some

play03:06

other statements Maybe unf but how are

play03:10

we going to summarize this into One

play03:13

single Idea of client

play03:15

Satisfaction Now second There's a More

play03:18

philosophical Question whether client

play03:21

Satisfaction really consists of 16 truly

play03:26

separate

play03:27

aspects and now finally reverse of is

play03:32

the ide that Maybe some stats measure

play03:35

the same underlying client sentiments

play03:38

and this is The Very Basic Idea Behind

play03:42

Factor

play03:43

analysis Now this Basic Idea is nicely

play03:47

illustrated by this diagram so first off

play03:51

on the right Side we see nine Out Of The

play03:54

16 statements and These are Simply The

play03:57

variables in our data nou The Very Basic

play04:00

Idea is that These nine statements

play04:03

really Only measure three underlying

play04:06

factors so for example the first three

play04:10

statements are believed To All measure a

play04:12

More general Sentiment of information

play04:16

Clarity So This imp that If information

play04:20

Clarity is improved then That's Going To

play04:23

positively affect All three of these

play04:26

statements and That's Why we see These

play04:29

Arrow

play04:37

indicate streng of Ars technically are

play04:42

Simply B coefficients that we regr

play04:46

analysis in short this model suggest

play04:50

that n observed variables

play04:59

pris isas we Factor analysis under

play05:04

Dimension reduction

play05:06

SPSS The Basic Idea is that we start off

play05:09

with nine Dimensions The observed

play05:12

statements in our data and we reduce

play05:14

Them into three Dimensions die

play05:17

underlying

play05:18

factors however this Factor analysis

play05:22

over here is Only One Of Two Main types

play05:25

of Factor analysis and sta

play05:37

There confirmat Factor analysis cfa for

play05:41

Short and this is not available in

play05:45

SPSS other

play05:47

packages cfa basically answers to What

play05:51

extent does a given factor modit

play05:56

dat ex

play06:07

a couple of Things for instance you want

play06:10

to replace These Question Marks by

play06:13

numbers that indicate the Strength Of

play06:16

These

play06:16

relations but also you probably want to

play06:19

test whether this entire model actually

play06:23

fits The data

play06:27

colm May

play06:32

typ of fact analysis is exploratory

play06:35

Factor analysis e for Short and in SPSS

play06:40

This Is Found under Factor EA Simply

play06:44

answers What is a likely Factor model

play06:48

some given data

play06:50

set typically want to use EA If Only

play06:55

dat No CLS

play07:03

min technical is Origin Factor analysis

play07:07

Only applied to cfa and not

play07:11

EA and some statistici claim that EA is

play07:16

not truly Factor

play07:18

analysis They do have a Bit Of A Point

play07:21

Here but Personally I think it's Way

play07:24

More constructive to see EA and cfa As

play07:30

M types of Factor

play07:32

analysis so Anyway in this video we're

play07:36

going to use exploratory Factor analysis

play07:39

for Our case Study so Let's Now Zoom in

play07:42

Just A Little Bit on what it does And

play07:45

how it

play07:46

works so first off efa Tries to answer

play07:50

three Basic questions and the first of

play07:53

these is how many underlying factors are

play07:57

measured by k variables

play07:59

Which are called items in Factor

play08:03

analysis so Again for Our case Study The

play08:06

items are These 16 Job Satisfaction

play08:10

statements Right Question number two is

play08:13

Which of these items measure Which

play08:17

factors so for example We Could conclude

play08:20

that Maybe the first Five items measure

play08:23

Factor number one Maybe The Next Three

play08:27

items measure Factor number

play08:37

is a challenging one Which real world

play08:40

characteristics do factors

play08:43

represent for example if the first Five

play08:47

items measure Factor Number One and

play08:50

items are all about Communication

play09:02

number May

play09:06

Cent In This case we probably conclude

play09:09

that Factor number represents some sort

play09:12

of Sentiment on client friendliness and

play09:15

So

play09:16

on at this Point hopefully you wonder

play09:20

How on earth Are we going to answer

play09:23

difficult

play09:29

starts by computing the pi correlations

play09:33

Among All variables so as a very Quick

play09:37

refresher a pieron correlation is a

play09:39

number between min One and plus one that

play09:43

indicates to what extent to quantitative

play09:46

variables are linear

play09:49

related now If that doesn't ring Any

play09:51

Bell then let's take a Quick Look at

play09:54

These scatter plots so for example over

play09:58

here we see

play10:01

correl of

play10:04

0.7 Clear pattern is that if the scores

play10:08

on variable a increase from left to

play10:11

Right then The scores on variable B also

play10:15

tend to increase and the extent to Which

play10:18

this happens is the Pier correlation

play10:21

Which is

play10:22

0.7 this scatter plot over

play10:26

here this May The

play10:35

let Take Quick example model and Let's

play10:39

for Now assume that This is correct so

play10:42

One Thing we see is that the first three

play10:45

items All measure the same underlying

play10:47

Factor Which is information Clarity So

play10:52

This imp that If information Clarity is

play10:55

to increased the scores All

play11:05

decre Clarity so in short the first

play11:09

three items measuring the same

play11:11

underlying Factor suggest That We should

play11:14

find strong Positive correlations Among

play11:17

These items this makes perfect Sense

play11:20

right now the second three items measure

play11:24

a Different underlying Factor Which is

play11:27

Client friendliness

play11:35

item items so in short this vor model

play11:40

proposes a pattern of correlations Which

play11:43

is that all correlations should be

play11:46

Fairly Close To zer except for the

play11:49

correlations Between these three items

play11:52

The correlations These items Fin

play11:58

correl items so Let's now take a look at

play12:02

the Actual correlations and see if we

play12:05

find this pattern or Maybe a Different

play12:09

One So Here's the Actual

play12:12

correlations but it's really hard to see

play12:14

Any pattern whatsoever Because We Simply

play12:17

have 81 numbers n if you work in Excel

play12:22

There's a really nice Little trick Which

play12:24

is conditional formatting color scales

play12:28

And then we click the first Option Now

play12:31

this applies background Colors That Run

play12:34

from Dark Green for the highest number

play12:37

in all of these cells to Dark Red for

play12:40

the lowest number in all of these cells

play12:42

Right And what we see Now is that we

play12:45

have a sort of green Area over here

play12:49

because all these correlations Among the

play12:51

first three items are Rather high

play12:55

however the first three items Don't

play12:57

correlate very strongly with

play13:06

let now revisit the Basic questions we

play13:09

trying to answer with Factor

play13:12

analysis so Again Question number one

play13:16

how many underlying factors are measured

play13:19

by k

play13:20

items well like We Just this Green Area

play13:24

indicates a group of variables that High

play13:30

su that Meure underlying

play13:35

Factor Here we One Green Area Here we

play13:39

see a second and here we see a Third

play13:42

Green Area So This pattern of

play13:45

correlations suggest That We May be

play13:47

measuring three underlying

play13:50

factors Question number two is Which of

play13:54

items Meure factors

play14:01

under is

play14:03

measured

play14:05

items second underlying factor is

play14:08

measured by the second three items and

play14:11

finally The Third underlying factor is

play14:14

measured By The Final three

play14:17

items The Third and Final Question Is

play14:20

Rather challenging It is Which real

play14:23

world characteristics do factors

play14:26

represent how are we to

play14:30

pry Basic factors are Artificial

play14:33

variables that represent Whatever

play14:37

underlying items have in Common so let

play14:41

this s in for Just Half A second and

play14:44

with this in mind let's take Another

play14:46

Final Look at Our

play14:49

correlations so Again Factor number one

play14:52

represents Whatever The items in

play14:58

Common pry is

play15:00

taken agreements Me Are followed through

play15:04

and my contact person Always does What

play15:07

he or She Promises So What do These

play15:10

three items have in

play15:12

Common say They All Con some element of

play15:17

reliability so That's What the first

play15:20

Factor probably

play15:22

represents

play15:25

simil items

play15:34

pered Factor number and finally These

play15:38

last three items All contain something

play15:41

about information Clarity so That's

play15:45

probably going to be Factor number

play15:48

three Now Our correlation approach

play15:51

nicely illustrat The Basic ide Behind

play15:53

Factor

play15:54

analysis real world datasets mostly

play15:57

require powerful techniques A Reason

play16:02

This is that we usually have to deal

play16:04

with correlation Matrix that May be huge

play16:07

and Fairly

play16:09

complex so These are the Actual

play16:12

correlations Among the 16 statements of

play16:15

our First case Study obviously at this

play16:19

Point we don't see Any pattern

play16:21

whatsoever

play16:23

but Remember my nice Little trick

play16:26

conditional formatting Color scale

play16:36

Green areas

play16:38

Any This is the first Point Our

play16:41

correlation approach is to fill with

play16:43

real

play16:45

life second and related Problem is If We

play16:49

don't see Any very Clear Green Are

play17:05

some No No I think These are Five so we

play17:09

really need something More objective to

play17:12

determine the Number of

play17:15

factors so in a real life analysis we

play17:18

compute Quality scores for Our factors

play17:21

That are known as eigen

play17:24

values to in later lecture Common of is

play17:29

that factors with eigen value over One

play17:32

are believed to be Real

play17:34

factors This table suggests that There f

play17:38

factors underlying Our 16 client

play17:41

Satisfaction

play17:42

statements a Third Point is that we want

play17:45

to interpret Our factors by Looking Into

play17:48

the correlations known as Factor loading

play17:53

factors

play17:57

items Factor loading and The Four colums

play18:01

are Our Four factors dened as Component

play18:05

Which is more or Less the same Thing as

play18:08

a Factor but in Any case What's

play18:12

important is that some items measure

play18:15

some factors a bit more strongly than

play18:18

other items and this is Something we

play18:21

want to take into account When

play18:23

interpreting The factors but Again wel

play18:26

cover this in a Next

play18:31

and Final is that Real analysis we Often

play18:36

add The Actual Factor scores as new

play18:39

variables to Our

play18:40

data so Here we see the four factors for

play18:44

Our First case Study and we could choose

play18:47

The report On These instead of the 16

play18:50

original statements and Again This Is

play18:54

Why we find Factor analysis under

play18:56

Dimension reduction in

play19:00

SPSS Right so that will conclude this

play19:03

video on some Basic ideas underlying

play19:06

exploratory Factor

play19:08

analysis Now before you Run The Actual

play19:11

analysis You should First Do a thoro

play19:15

data screening so That's What I'll cover

play19:18

in the next video Anyway I Hope You

play19:21

Found this video helpful please Give It

play19:23

A thumbs up and subscribe to Our Channel

play19:26

and if Any

play19:33

[Muziek]

play19:36

than watching see next time

Rate This
โ˜…
โ˜…
โ˜…
โ˜…
โ˜…

5.0 / 5 (0 votes)

Related Tags
Factor AnalysisClient SatisfactionData AnalysisSPSS TutorialStatistical MethodDimension ReductionExploratory AnalysisLikert ScaleUnemployment AgencyResearch Methodology