Maximum Likelihood Estimation (Part 1)
Summary
TLDRIn this video, the speaker explores parameter estimation using Maximum Likelihood Estimation (MLE) for both a normal distribution and the Ornstein-Uhlenbeck process, which is commonly used in pairs trading. The speaker demonstrates how to estimate the mean and standard deviation of a normal distribution using Python and the scipy library, showcasing the numerical approach to solving these problems. With a focus on practical application, the video introduces both analytical and numerical methods to derive parameters, and teases a follow-up video applying these concepts to real-world pairs trading with ETFs like GLD.
Takeaways
- 😀 The video discusses the mathematics behind optimal mean reversion trading, as explained in a book titled 'Optimal Mean Reversion Trading'.
- 😀 The author explains the use of Maximum Likelihood Estimation (MLE) for parameter estimation in both normal distribution and Ornstein-Uhlenbeck processes.
- 😀 The script compares deriving analytical expressions for parameters manually versus solving the problem numerically with a computer.
- 😀 The video begins by focusing on parameter estimation for the normal distribution to explain the basic concepts before moving on to more complex processes.
- 😀 The concept of maximum likelihood estimation (MLE) is explained, emphasizing how to estimate parameters such as mu and sigma using observed data.
- 😀 The author highlights the process of using Python’s SciPy library, particularly the minimize function, to solve numerical optimization problems.
- 😀 The likelihood of observed data points is calculated using the normal distribution PDF (Probability Density Function), and their combined likelihood is obtained by multiplying individual likelihoods.
- 😀 The problem of finding the parameters that maximize the likelihood is tackled using calculus, but the author suggests simplifying the process by using the logarithm of the likelihood.
- 😀 The optimal values for mu (mean) and sigma (standard deviation) are derived as the sample mean and sample standard deviation, respectively, simplifying the estimation.
- 😀 The video also provides a solution for numerically solving MLE when the distribution is not normal or when it's difficult to solve analytically.
- 😀 To demonstrate the numerical approach, the author generates random data and uses optimization techniques to estimate the parameters, obtaining values close to the expected mu and sigma.
Q & A
What is the main goal of the video?
-The main goal of the video is to explain how to estimate parameters for a pairs trading strategy using maximum likelihood estimation (MLE) for both the normal distribution and the Ornstein-Uhlenbeck process.
Why does the presenter want to demonstrate both algebraic and numerical methods?
-The presenter wants to show both methods because performing algebraic calculations for parameter estimation can be error-prone, especially over many pages of algebra. Using a numerical approach with a computer can help avoid mistakes and simplify the process.
What statistical distribution do the authors in the book assume for the pairs trade price?
-The authors in the book assume that the stock behavior, specifically for the pairs trade price, follows an Ornstein-Uhlenbeck process.
What is the first distribution the presenter uses to demonstrate parameter estimation?
-The first distribution the presenter uses is the normal distribution, as it is easier to derive and check algebraically and numerically.
What is maximum likelihood estimation (MLE) used for in this context?
-In this context, maximum likelihood estimation (MLE) is used to estimate the parameters (mean and standard deviation) of a statistical distribution based on observed data.
How does the presenter visualize the normal distribution?
-The presenter visualizes the normal distribution by plotting the probability density function (PDF) over a range of X values, using a specified mean and standard deviation.
What does the combined likelihood represent?
-The combined likelihood represents the product of individual likelihoods for multiple observed data points, providing a measure of how likely the entire dataset is given the chosen parameters.
What is the main mathematical step involved in parameter estimation for the normal distribution?
-The main mathematical step is to maximize the likelihood function. This involves taking the derivative of the log-likelihood function with respect to the parameters (mean and standard deviation), setting them equal to zero, and solving for the optimal values.
Why does the presenter take the logarithm of the likelihood function?
-The presenter takes the logarithm of the likelihood function to simplify the product of many small terms into a sum of individual logs, making it easier to differentiate and solve for the optimal parameters.
How does the presenter implement a numerical approach to parameter estimation?
-The presenter implements a numerical approach by using the scipy minimize function, which minimizes the negative log-likelihood function. This allows for estimating the parameters even when the distribution is not normal or the exact analytical solution is difficult to derive.
Outlines

このセクションは有料ユーザー限定です。 アクセスするには、アップグレードをお願いします。
今すぐアップグレードMindmap

このセクションは有料ユーザー限定です。 アクセスするには、アップグレードをお願いします。
今すぐアップグレードKeywords

このセクションは有料ユーザー限定です。 アクセスするには、アップグレードをお願いします。
今すぐアップグレードHighlights

このセクションは有料ユーザー限定です。 アクセスするには、アップグレードをお願いします。
今すぐアップグレードTranscripts

このセクションは有料ユーザー限定です。 アクセスするには、アップグレードをお願いします。
今すぐアップグレード関連動画をさらに表示
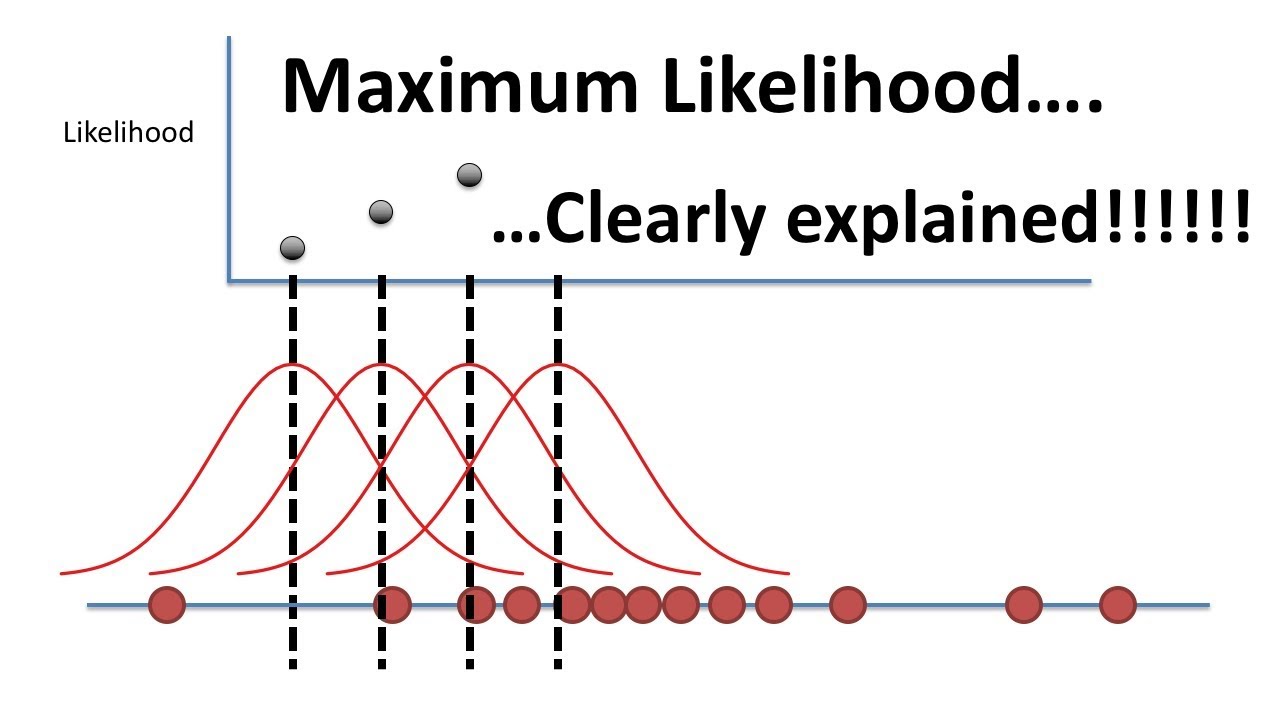
Maximum Likelihood, clearly explained!!!
Presentation16: Using Maximum Likelihood Estimation to Calibrate a Discrete Time Markov Model

Applying MLE for estimating the variance of a time series
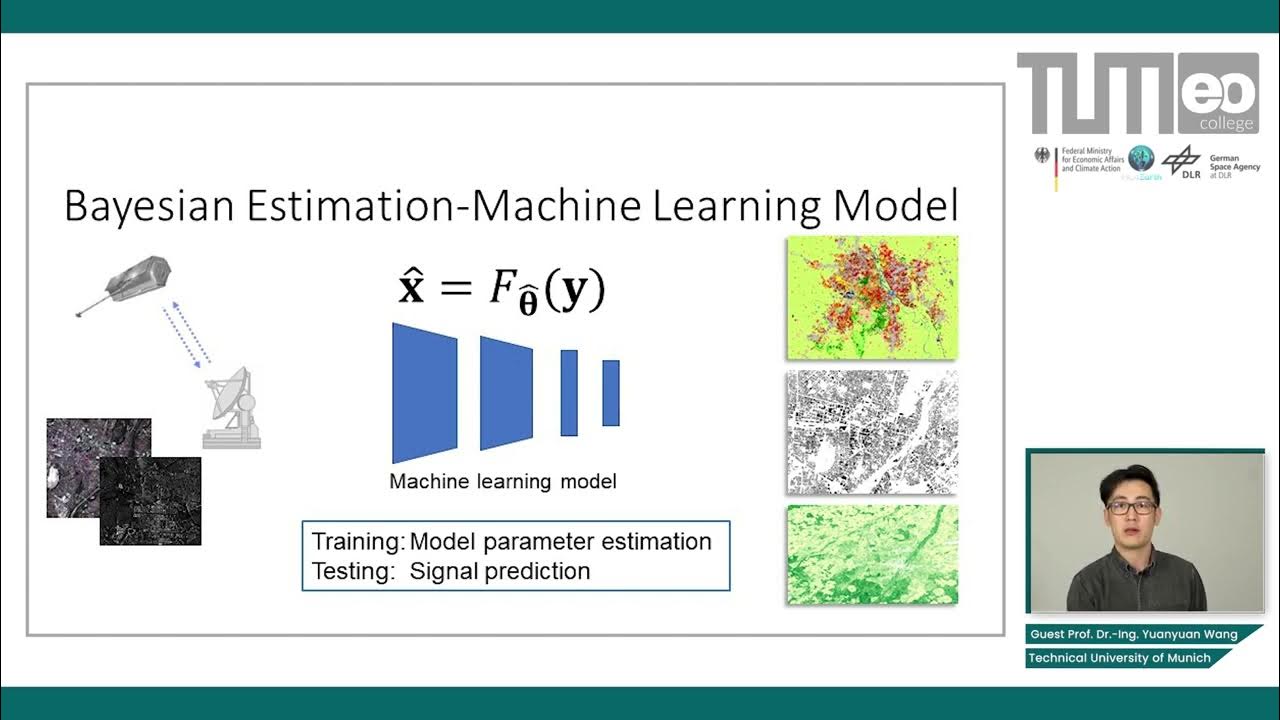
Bayesian Estimation in Machine Learning - Maximum Likelihood and Maximum a Posteriori Estimators
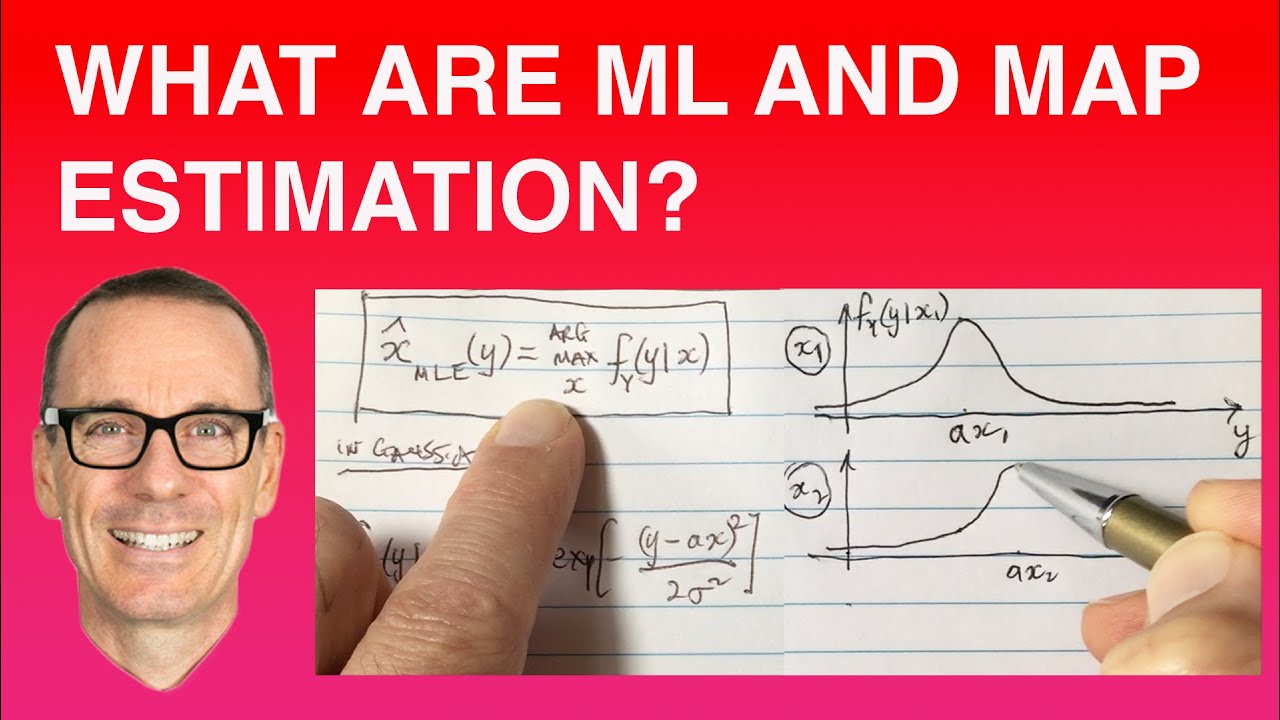
What are Maximum Likelihood (ML) and Maximum a posteriori (MAP)? ("Best explanation on YouTube")

MCMC Gibbs Sampler part 1 pendahuluan
5.0 / 5 (0 votes)
