JANGKAUAN, HAMPARAN, SIMPANGAN KUARTIL, SIMPANGAN RATA RATA, RAGAM DAN STANDAR DEVIASI
Summary
TLDRIn this educational video, the presenter discusses key statistical concepts such as range, interquartile range, variance, and standard deviation. The video walks through practical examples, explaining the formulas and steps for calculating each concept. From finding the range by subtracting the smallest value from the largest, to determining the interquartile range and quartile deviation, the tutorial provides clear instructions. It also covers calculating the mean, the mean deviation, variance, and standard deviation, with detailed explanations of each calculation. This video is a comprehensive guide for anyone looking to understand basic statistics and improve their skills in data analysis.
Takeaways
- 😀 The tutorial covers several important statistical concepts, including range, interquartile range, variance, and standard deviation.
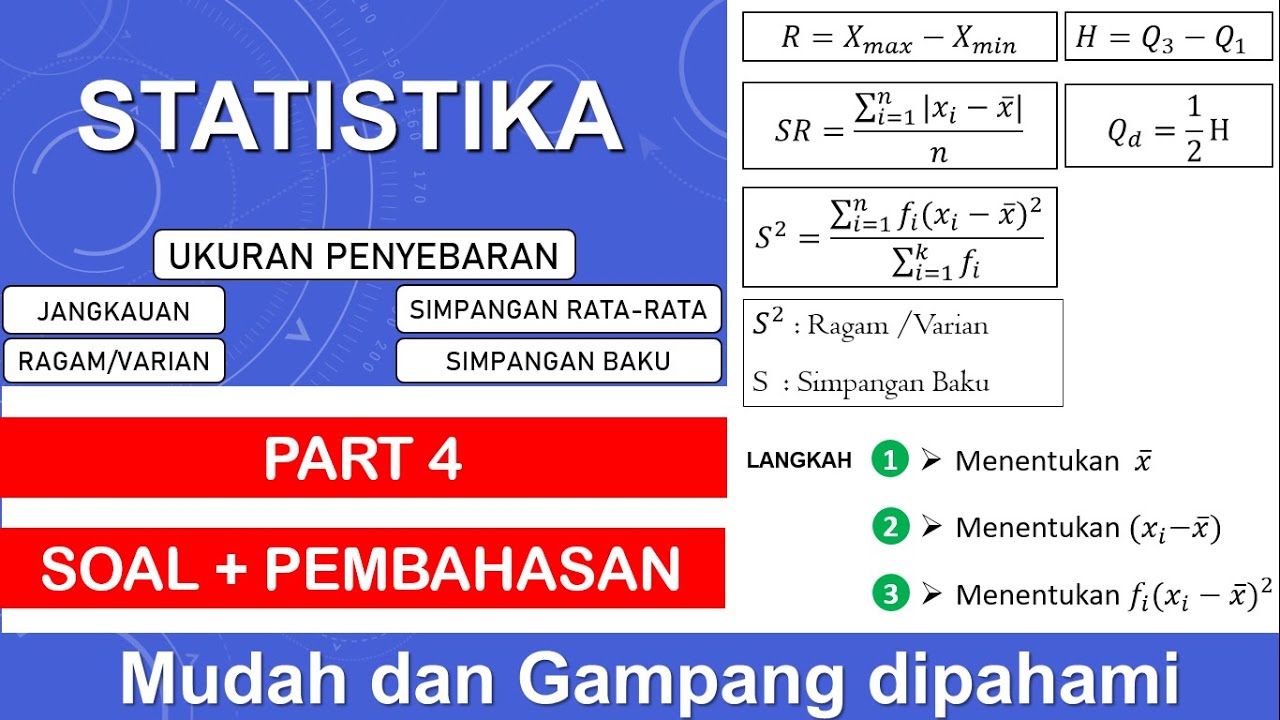
- 😀 The range (jangkauan) is calculated by subtracting the smallest value (X_min) from the largest value (X_max) in the data set.
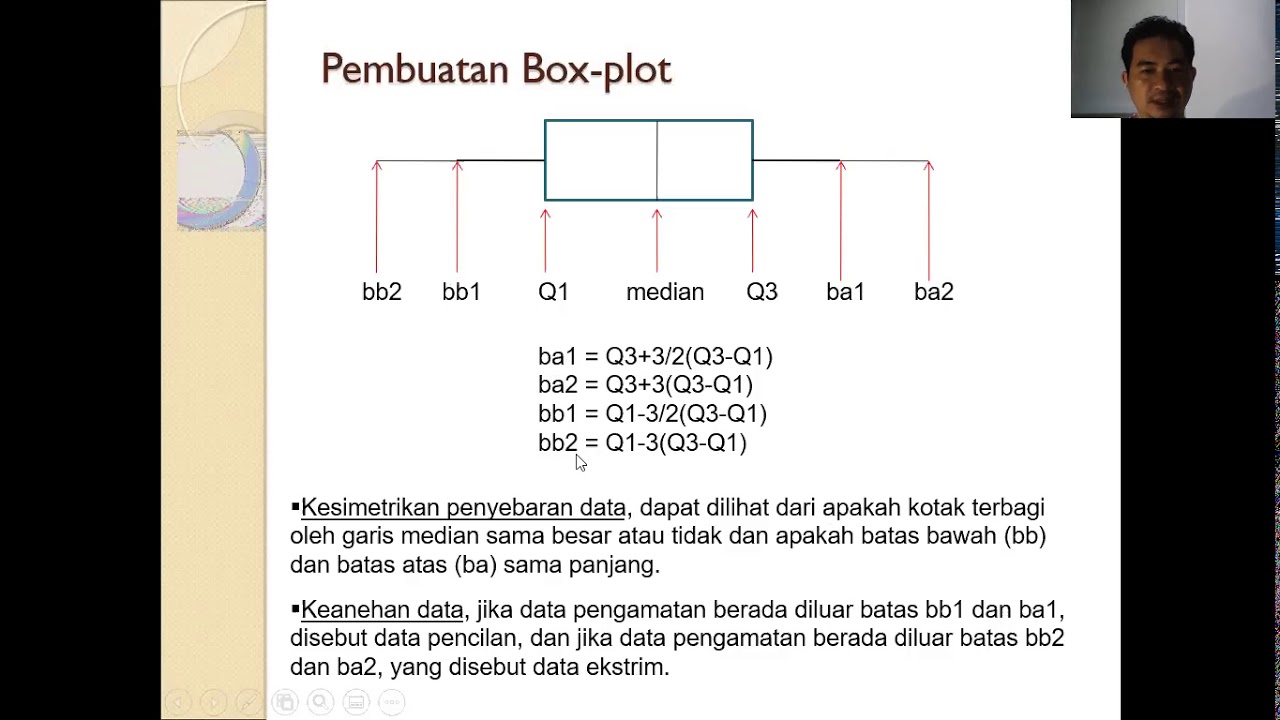
- 😀 The interquartile range (hamparan) is found by subtracting the first quartile (Q1) from the third quartile (Q3).
- 😀 To calculate Q1 and Q3, the data is split into two equal halves, and then those halves are further divided to find the quartiles.
- 😀 The semi-interquartile range (simpangan kuartil) is half of the interquartile range, which gives a measure of data spread.
- 😀 The mean deviation (simpangan rata-rata) is calculated by finding the mean of the data and then computing the average of absolute deviations from that mean.
- 😀 The formula for variance (ragam/variansi) involves summing the squared differences between each data point and the mean, and then dividing by the number of data points.
- 😀 Variance (ragam) gives a measure of how spread out the values in the data set are around the mean.
- 😀 The standard deviation (simpangan baku) is the square root of the variance and provides a measure of the average deviation from the mean.
- 😀 The final result for each calculation (range, interquartile range, mean deviation, variance, and standard deviation) was shown with examples and step-by-step explanations.
Q & A
What is the formula for calculating the range in statistics?
-The formula for calculating the range is J = Xmax - Xmin, where Xmax is the largest number in the dataset and Xmin is the smallest number.
How do you determine the interquartile range (IQR) using the given data?
-The interquartile range is calculated as H = Q3 - Q1, where Q3 is the third quartile (upper median) and Q1 is the first quartile (lower median).
What method is suggested for calculating quartiles without using formulas?
-The method involves splitting the data into two equal parts, with 5 numbers on each side if there are 11 data points. The median of each side represents Q1 and Q3.
How is the semi-interquartile range (also known as quartile deviation) calculated?
-The semi-interquartile range is calculated using the formula QD = 1/2 * (Q3 - Q1). This is essentially half of the interquartile range.
What is the process for calculating the mean deviation in this example?
-To calculate the mean deviation, you first find the mean of the dataset, then subtract the mean from each data point, take the absolute value, and divide the sum of these absolute deviations by the number of data points.
How do you calculate the average of a dataset?
-To calculate the average (mean), sum all the values in the dataset and then divide the sum by the total number of values in the dataset.
What role does the absolute value play in calculating the mean deviation?
-The absolute value is used to ensure that all deviations from the mean are positive, regardless of whether the individual values are above or below the mean.
How is variance (ragam) calculated in this example?
-Variance is calculated by finding the squared differences between each data point and the mean, summing those squared differences, and then dividing by the number of data points.
What is the formula for calculating standard deviation?
-Standard deviation is the square root of the variance (S = √(variance)). The variance is calculated from the squared deviations of data points from the mean.
Why is the standard deviation often preferred over variance?
-Standard deviation is preferred because it is in the same units as the data, making it more interpretable, while variance is in squared units.
Outlines

このセクションは有料ユーザー限定です。 アクセスするには、アップグレードをお願いします。
今すぐアップグレードMindmap

このセクションは有料ユーザー限定です。 アクセスするには、アップグレードをお願いします。
今すぐアップグレードKeywords

このセクションは有料ユーザー限定です。 アクセスするには、アップグレードをお願いします。
今すぐアップグレードHighlights

このセクションは有料ユーザー限定です。 アクセスするには、アップグレードをお願いします。
今すぐアップグレードTranscripts

このセクションは有料ユーザー限定です。 アクセスするには、アップグレードをお願いします。
今すぐアップグレード関連動画をさらに表示
Statistika Part. 4 | Ukuran Penyebaran, Ragam, Varian, Simpangan Rata-rata, Simpangan Baku

Ukuran Dispersi dan Variasi

Ukuran Penyebaran Data Tunggal | Statistika Matematika Wajib Kelas 12 | Catatan Matematika @Bang-RP
Measures of Spread & Variability: Range, Variance, SD, etc| Statistics Tutorial | MarinStatsLectures

UKURAN PENYEBARAN (DATA TUNGGAL)
Pertemuan ke 5 Statistika sosial
5.0 / 5 (0 votes)
