Powerful swing or scalp strategy tuned for minimal drawdown and consistent results!
Summary
TLDRIn this video, the creator dives into a customized stock trading strategy utilizing the Relative Strength Index (RSI), Bollinger Bands, and the Average True Range (ATR) indicator. Initially inspired by the 'Killer RSI Bollinger Band Strategy,' the creator refines and validates the strategy, now renamed the 'Sirius RSI Bollinger Band Strategy.' The strategy aims for swing trading but can be adapted to scalping. Detailed rules for entry, stop loss, and profit targets are explained, followed by a thorough backtest analysis, highlighting the strategy's potential for high volatility trading, drawdowns, and its applicability across various time frames.
Takeaways
- 😀 The strategy is called the Sirius RSI Bollinger Band Strategy, which evolved from the Killer RSI Bollinger Band Strategy.
- 📊 The strategy uses three main indicators: RSI (Relative Strength Index), Bollinger Bands, and Average True Range (ATR).
- 📈 RSI compares average gains and losses over the last 14 periods to indicate overbought or oversold conditions.
- 📉 The Bollinger Bands are based on a 30-period moving average, with a multiplier of two standard deviations for the upper and lower bands.
- 🔎 Bollinger Bandwidth is the difference between the upper and lower bands, providing a volatility measurement.
- 🔄 ATR calculates price volatility and helps determine adaptive stop-loss and profit targets based on recent volatility.
- 💡 The strategy targets long trades when the price drops below the lower Bollinger Band and the RSI falls below 25, followed by a strong upward movement.
- ⏱ The entry occurs at the open of the candle following the trigger candle, with a profit target of 2x ATR and stop-loss of 3x ATR.
- 🔧 A key takeaway is that backtesting revealed an annualized return of 44% with a $5,000 investment per trade, assuming 1,242 trades.
- 📉 Drawdown can be substantial, but adjusting risk exposure per trade reduces the risk of blowing the account, as shown by testing with $1,000 per trade.
- ⏳ For scalping and day trading, the strategy can be adapted for lower time frames (e.g., 30-minute candles), with a Bollinger bandwidth threshold adjusted to 0.15.
Q & A
What is the purpose of the Sirius RSI Bollinger Band strategy?
-The purpose of the Sirius RSI Bollinger Band strategy is to identify high-volatility opportunities in the stock market using a combination of the RSI (Relative Strength Index), Bollinger Bands, and Average True Range (ATR). This strategy aims to enter trades when stocks show significant price drops followed by a potential reversal, using calculated profit targets and stop losses based on volatility.
What are the key indicators used in the Sirius RSI Bollinger Band strategy?
-The strategy uses three key indicators: the Relative Strength Index (RSI), Bollinger Bands, and Average True Range (ATR). The RSI measures recent price momentum, the Bollinger Bands identify volatility and price levels, and the ATR helps set adaptive stop losses and profit targets based on volatility.
How does the Relative Strength Index (RSI) function in this strategy?
-The RSI compares the average percentage gain to the average percentage loss over the last 14 candles. In the strategy, the RSI is used to gauge whether a stock is oversold, with a value below 25 indicating potential buying opportunities when combined with other conditions.
Why was the Bollinger Bands period changed to 30 bars for this strategy?
-The default setting for Bollinger Bands is 20 bars, but for the Sirius strategy, the period was increased to 30 bars to better capture the stock’s volatility over a longer time frame, which can provide more reliable signals for price movement and entry points.
What is the significance of the Bollinger Bandwidth in the strategy?
-The Bollinger Bandwidth is the difference between the upper and lower Bollinger Bands, expressed as a fraction of the middle band. This indicator helps assess market volatility. A higher bandwidth indicates larger price movements, which are crucial for identifying high volatility situations in the strategy.
How does the ATR (Average True Range) help in determining the stop loss and profit targets?
-The ATR helps set stop losses and profit targets by measuring the volatility of a stock. The strategy uses a multiple of the ATR from the previous candle to calculate adaptive stop losses and profit targets, ensuring they are suited to the stock’s recent price movement rather than fixed values.
What is the role of the Bollinger Band threshold in the strategy?
-The Bollinger Band threshold is used to filter trades based on volatility. The threshold for the daily time frame is set at 0.3, meaning that the distance between the upper and lower bands must be greater than 30% of the stock price for a trade to be considered, signaling higher volatility.
What happens if a stock does not hit the target or stop loss within the set duration?
-If a stock does not hit the target or stop loss within the set duration (50 bars in this case), it will be sold at whatever price is available at that time. This ensures that trades are handled consistently within the backtesting system.
How does the strategy perform when tested with a $10,000 account and $5,000 per trade?
-When tested with a $10,000 account and risking $5,000 per trade, the strategy showed an annual gain of 89%. However, the drawdown could be significant, with the account potentially losing the entire balance, though gains would eventually recover the losses and more over time.
What adjustments can be made to reduce the strategy's risk exposure?
-To reduce risk, you can decrease the amount of capital risked per trade. For example, by risking $1,000 per trade instead of $5,000, the overall account gains a more manageable 8.9% per year, with a much lower maximum drawdown of 26%, avoiding catastrophic losses.
Outlines

このセクションは有料ユーザー限定です。 アクセスするには、アップグレードをお願いします。
今すぐアップグレードMindmap

このセクションは有料ユーザー限定です。 アクセスするには、アップグレードをお願いします。
今すぐアップグレードKeywords

このセクションは有料ユーザー限定です。 アクセスするには、アップグレードをお願いします。
今すぐアップグレードHighlights

このセクションは有料ユーザー限定です。 アクセスするには、アップグレードをお願いします。
今すぐアップグレードTranscripts

このセクションは有料ユーザー限定です。 アクセスするには、アップグレードをお願いします。
今すぐアップグレード関連動画をさらに表示
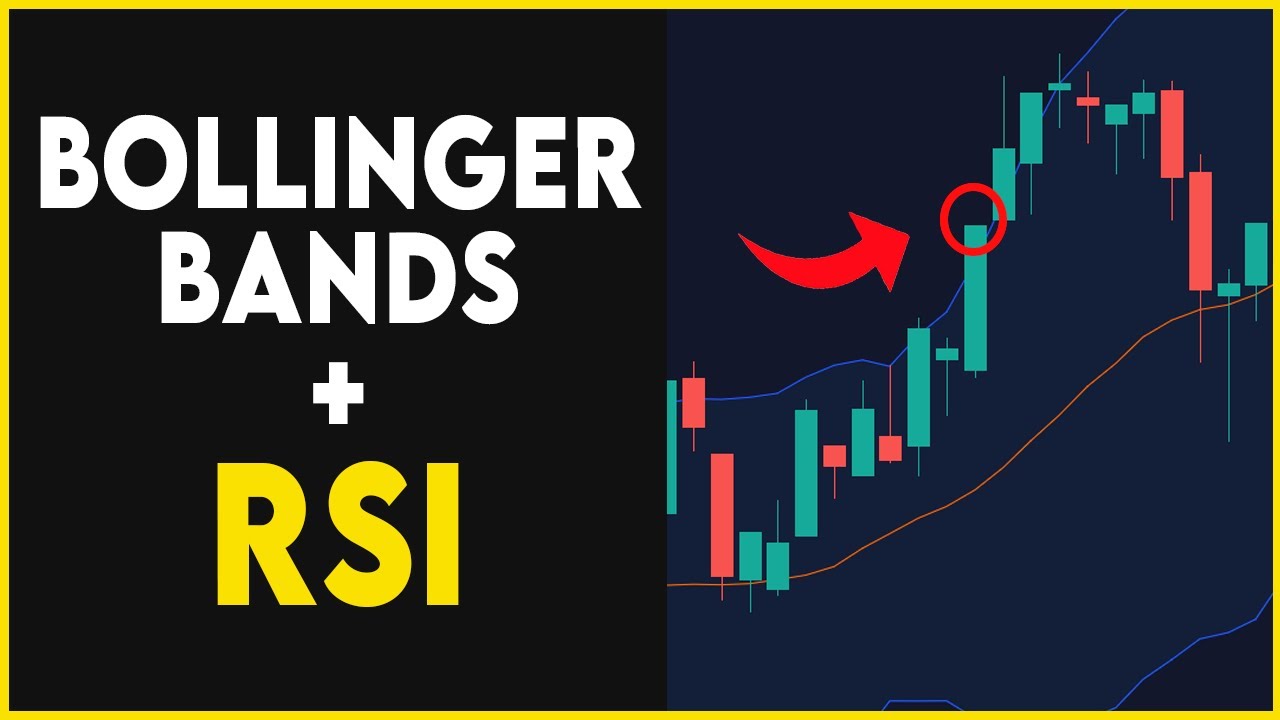
Bollinger Band + RSI Trading Strategy That Actually Works
SAFEX BROKER - FAZENDO MAIS DE R$2.100 REAIS UTILIZANDO RSI E BDB
TEST SYSTEM TRADING RSI (6) dan EMA (500) : Hasilnya bagus
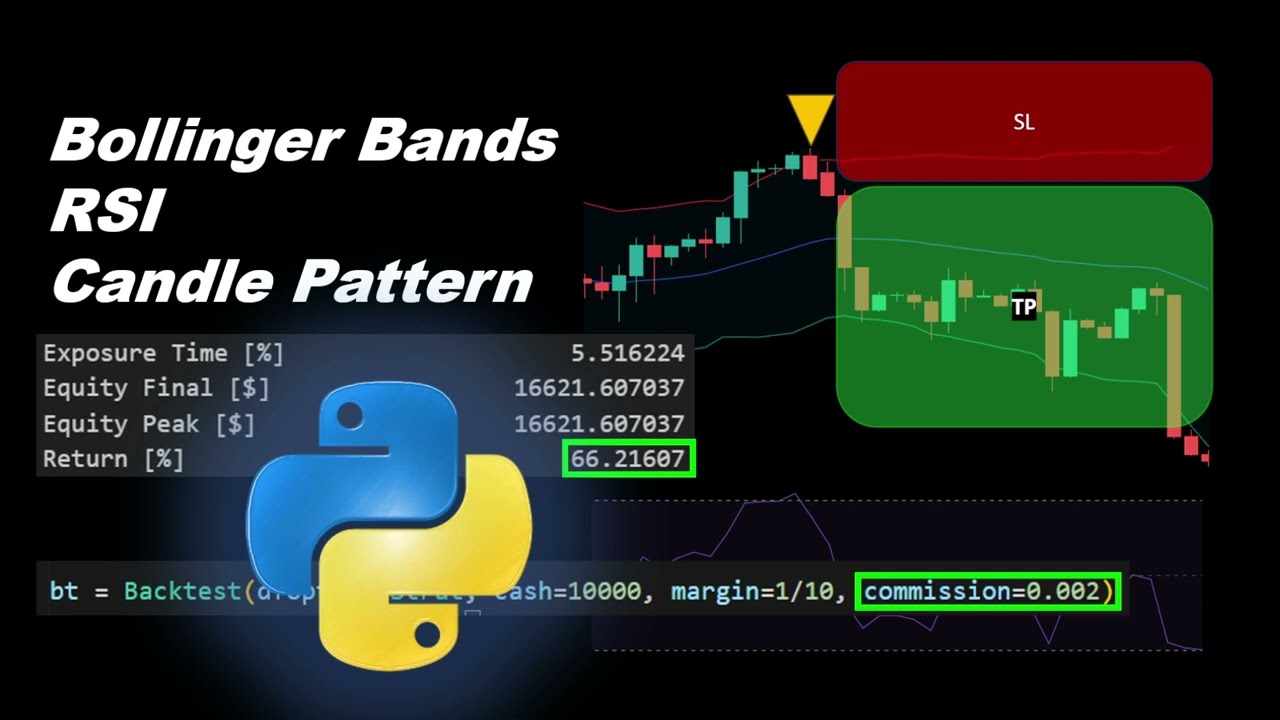
Profitable Strategy Using Bollinger Bands and RSI Automated in Python

15 Best Trading Indicators on Pocket Option

BEST Trend Line Breakout Strategy on TradingView 📈
5.0 / 5 (0 votes)
