BEST Trend Line Breakout Strategy on TradingView 📈
Summary
TLDRThis video presents a unique trading strategy using TradingView, incorporating indicators like Trend Lines with Breaks by Lux Algo, RSI (Relative Strength Index), and the Trauma Indicator. For a buy signal, the strategy involves waiting for the price to be above the trauma line and entering after a trend line breakout, exiting when the RSI becomes overbought. For a sell signal, the price should be below the trauma line, followed by a red trend line break signal, with exit occurring once the RSI is oversold. This approach focuses on trend analysis and RSI levels for optimal entries and exits.
Takeaways
- 😀 Make sure to search for 'trend lines with breaks' by Lux Algo in the TradingView indicators.
- 😀 In the settings, enable the option to show only confirmed breakouts.
- 😀 Add the Relative Strength Index (RSI) to the chart for better analysis.
- 😀 Add the Trauma indicator to the chart as a key component of the strategy.
- 😀 For a Buy Signal, ensure the price is above the Trauma (red line).
- 😀 Enter a Buy trade once a trend line breakout signal is confirmed.
- 😀 Exit the Buy position when the RSI is overbought, i.e., above the 70 line.
- 😀 For a Sell Signal, wait for the price to be below the Trauma (red line).
- 😀 Enter a Sell trade after a red trend line break signal is confirmed.
- 😀 Exit the Sell position when the RSI is oversold (below 30).
- 😀 The strategy combines trend line breakouts, RSI, and Trauma indicators for entry and exit decisions.
Q & A
What is the first step in setting up the trading strategy in TradingView?
-The first step is to go to the indicators section on TradingView and search for 'trend lines with breaks,' making sure to select the one by Lux Algo.
How do you configure the trend lines indicator after adding it?
-After adding the trend lines indicator, go to the settings and enable the option 'Show only confirmed breakouts.'
What additional indicators are needed for this strategy besides the trend lines indicator?
-You will also need to add the Relative Strength Index (RSI) and the Trauma Indicator.
What is the significance of the Trauma indicator in this strategy?
-The Trauma indicator is used to determine whether the price is above or below a certain level (represented by the red line), which helps in confirming trade signals.
What conditions should be met to enter a buy trade?
-To enter a buy trade, the price should be above the Trauma line (red line), and a trend line breakout signal should be triggered.
When should you exit a buy position in this strategy?
-You should exit the buy position when the RSI becomes overbought, meaning it goes above the 70 line.
What are the conditions for a sell trade signal?
-For a sell signal, the price should be below the Trauma line (red line), and a red trend line break signal should be triggered.
When should you exit a sell position?
-You should exit the sell position when the RSI becomes oversold, indicating it has dropped below the 30 line.
Why is the RSI important in this trading strategy?
-The RSI helps to identify overbought or oversold conditions, which are used as exit signals to lock in profits or cut losses at the right time.
What does the trend line break signal indicate in this strategy?
-The trend line break signal indicates a potential reversal or continuation in the market, acting as a trigger for entry or exit points in both buy and sell trades.
Outlines

This section is available to paid users only. Please upgrade to access this part.
Upgrade NowMindmap

This section is available to paid users only. Please upgrade to access this part.
Upgrade NowKeywords

This section is available to paid users only. Please upgrade to access this part.
Upgrade NowHighlights

This section is available to paid users only. Please upgrade to access this part.
Upgrade NowTranscripts

This section is available to paid users only. Please upgrade to access this part.
Upgrade NowBrowse More Related Video

Profit $38,960 Hidden Trading Secret: The Moving Average and RSI Strategy

How To Trade Smart Money Concepts | LuxAlgo Full 2025 Updated Guide and Trading Strategy

This NEW Indicator Is Beyond Your Imagination! It Will Blow Your Mind!

Powerful swing or scalp strategy tuned for minimal drawdown and consistent results!

We Tested This FREE TradingView Indicator — Full Backtest Results (Zero Lag Trend Signals)
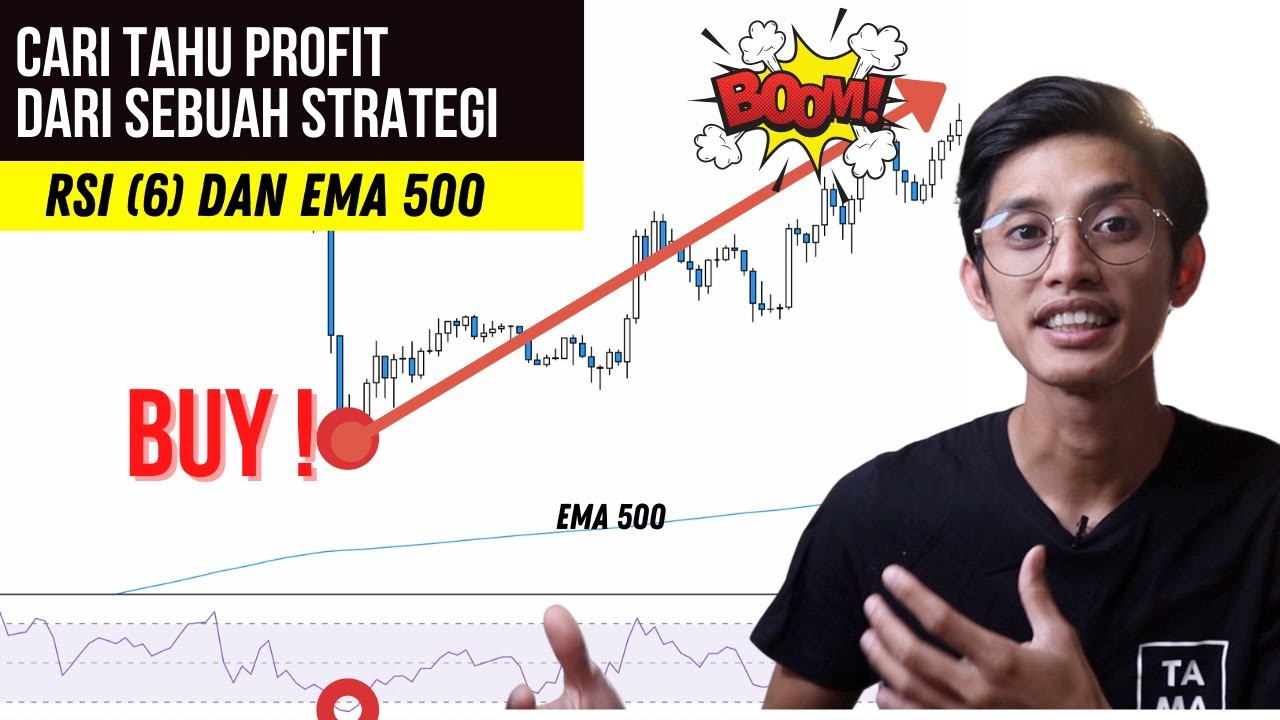
TEST SYSTEM TRADING RSI (6) dan EMA (500) : Hasilnya bagus
5.0 / 5 (0 votes)